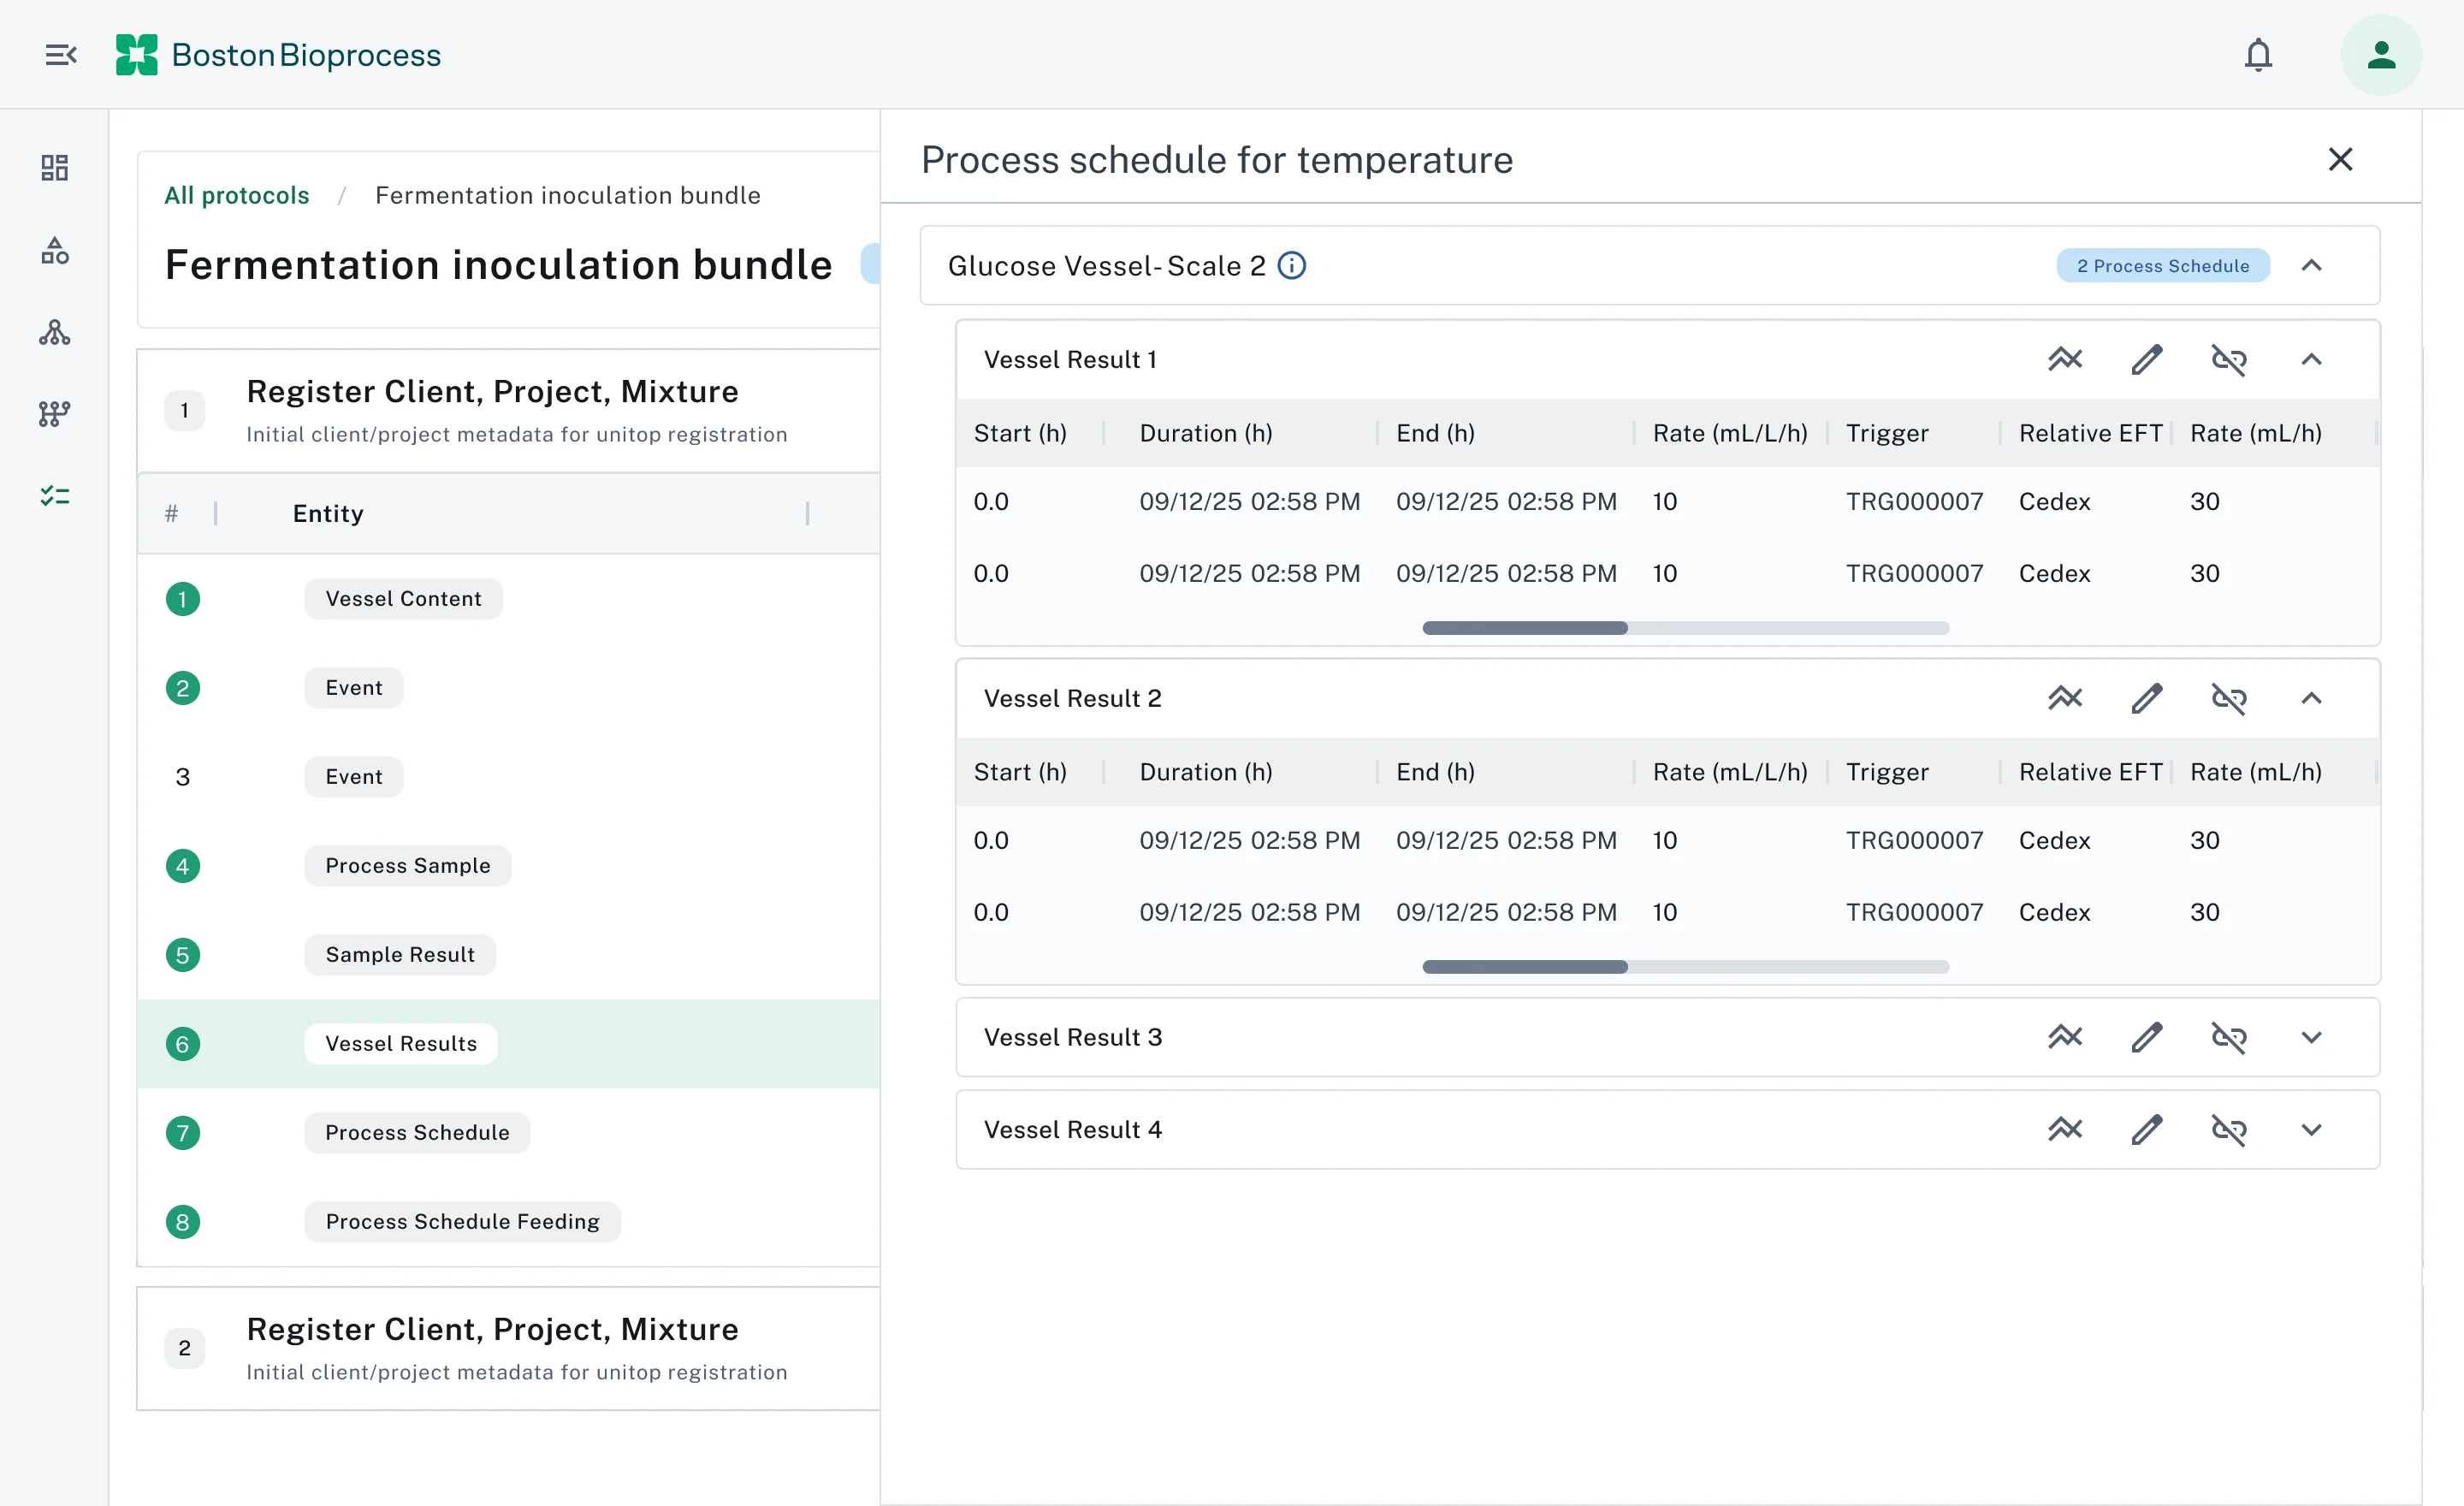
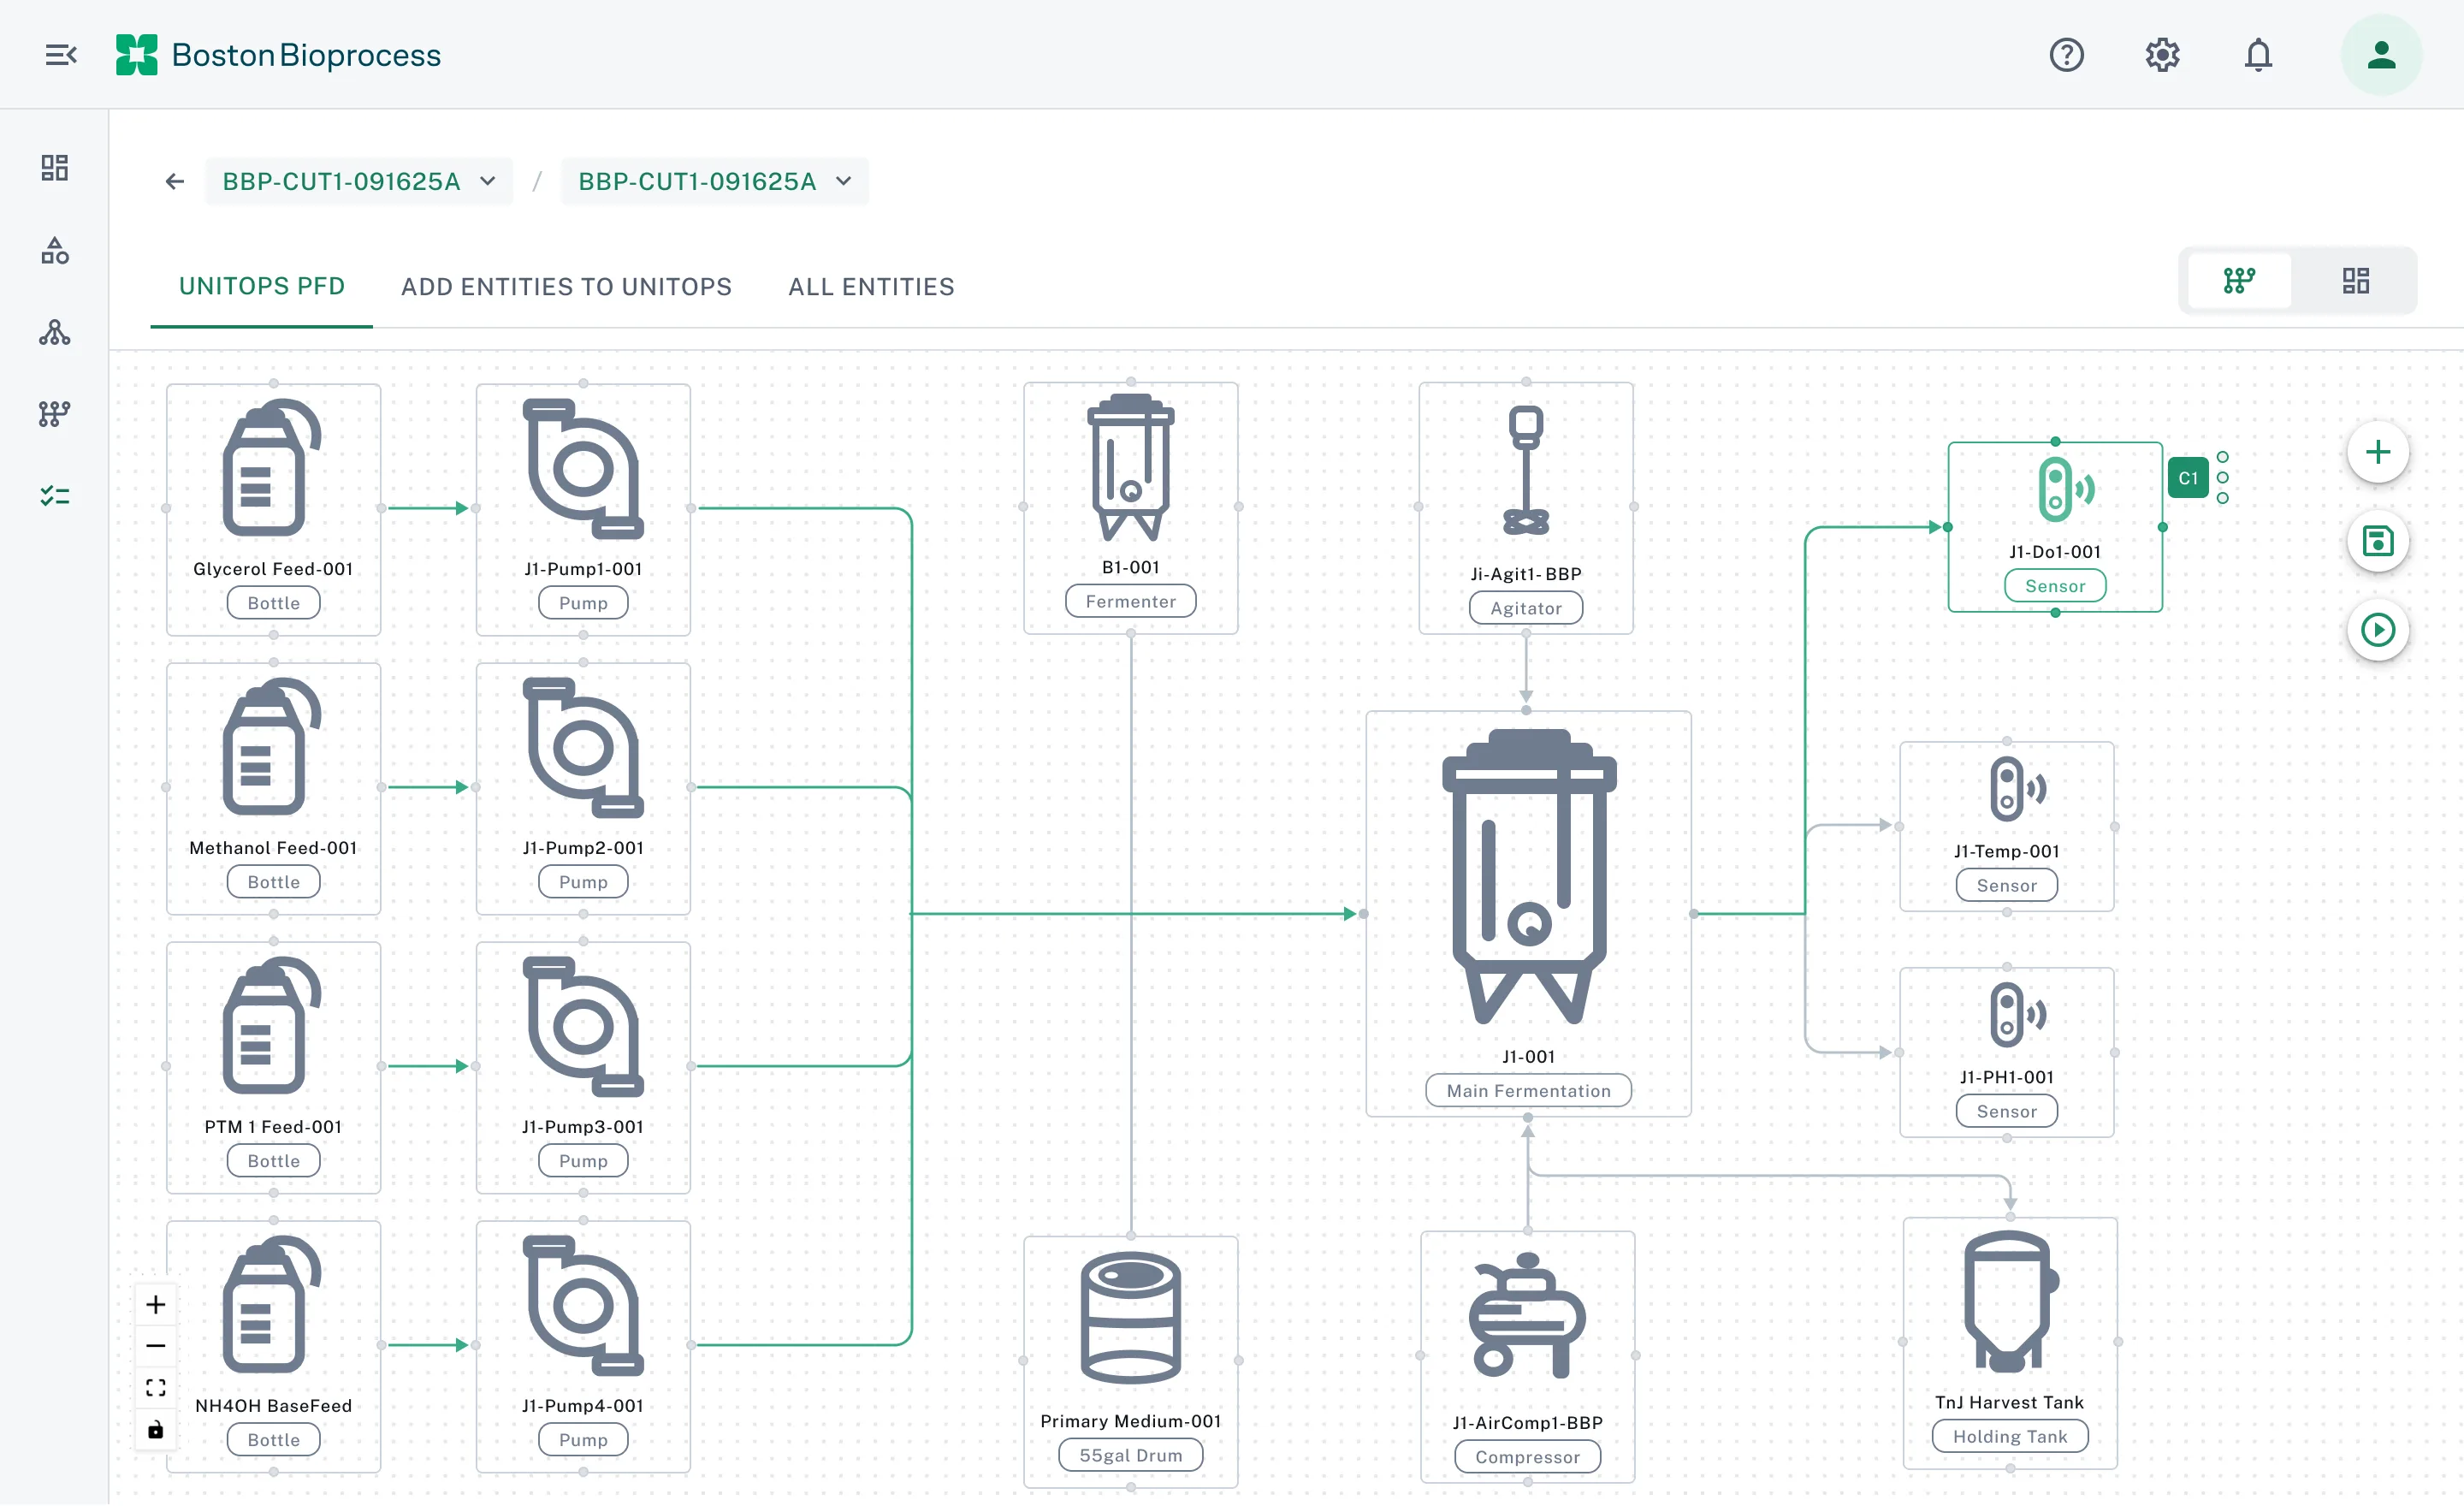
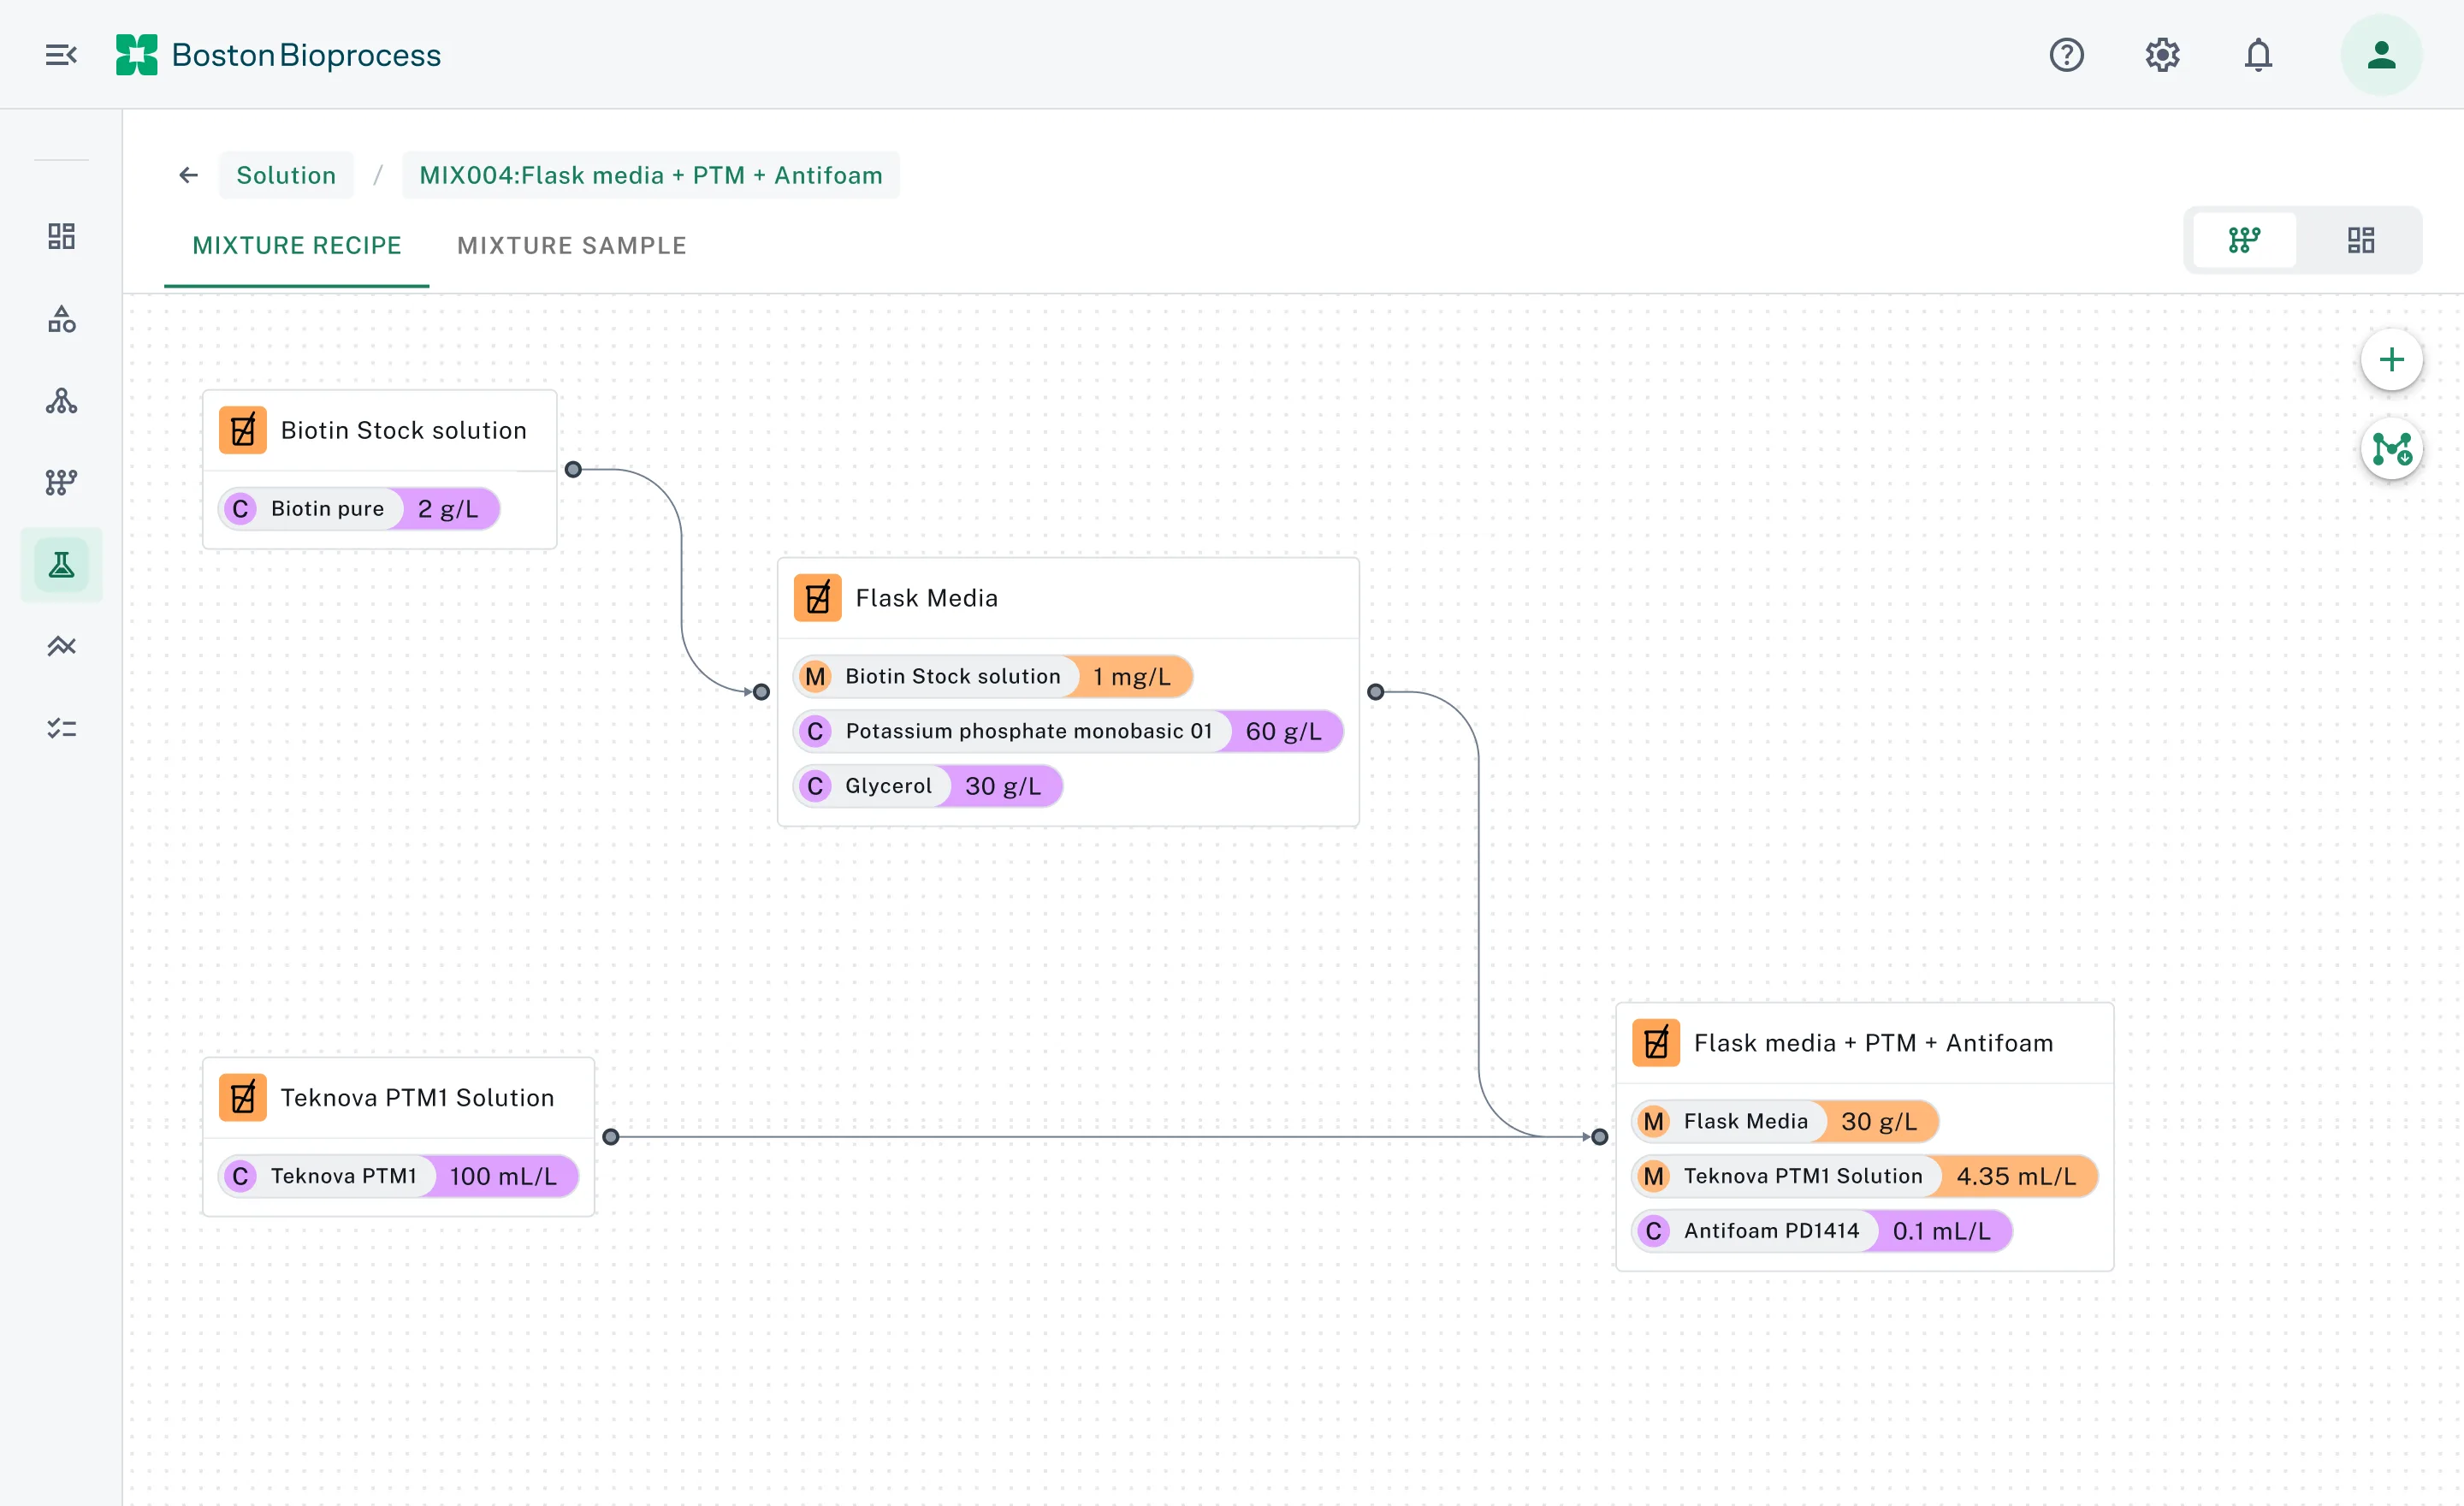
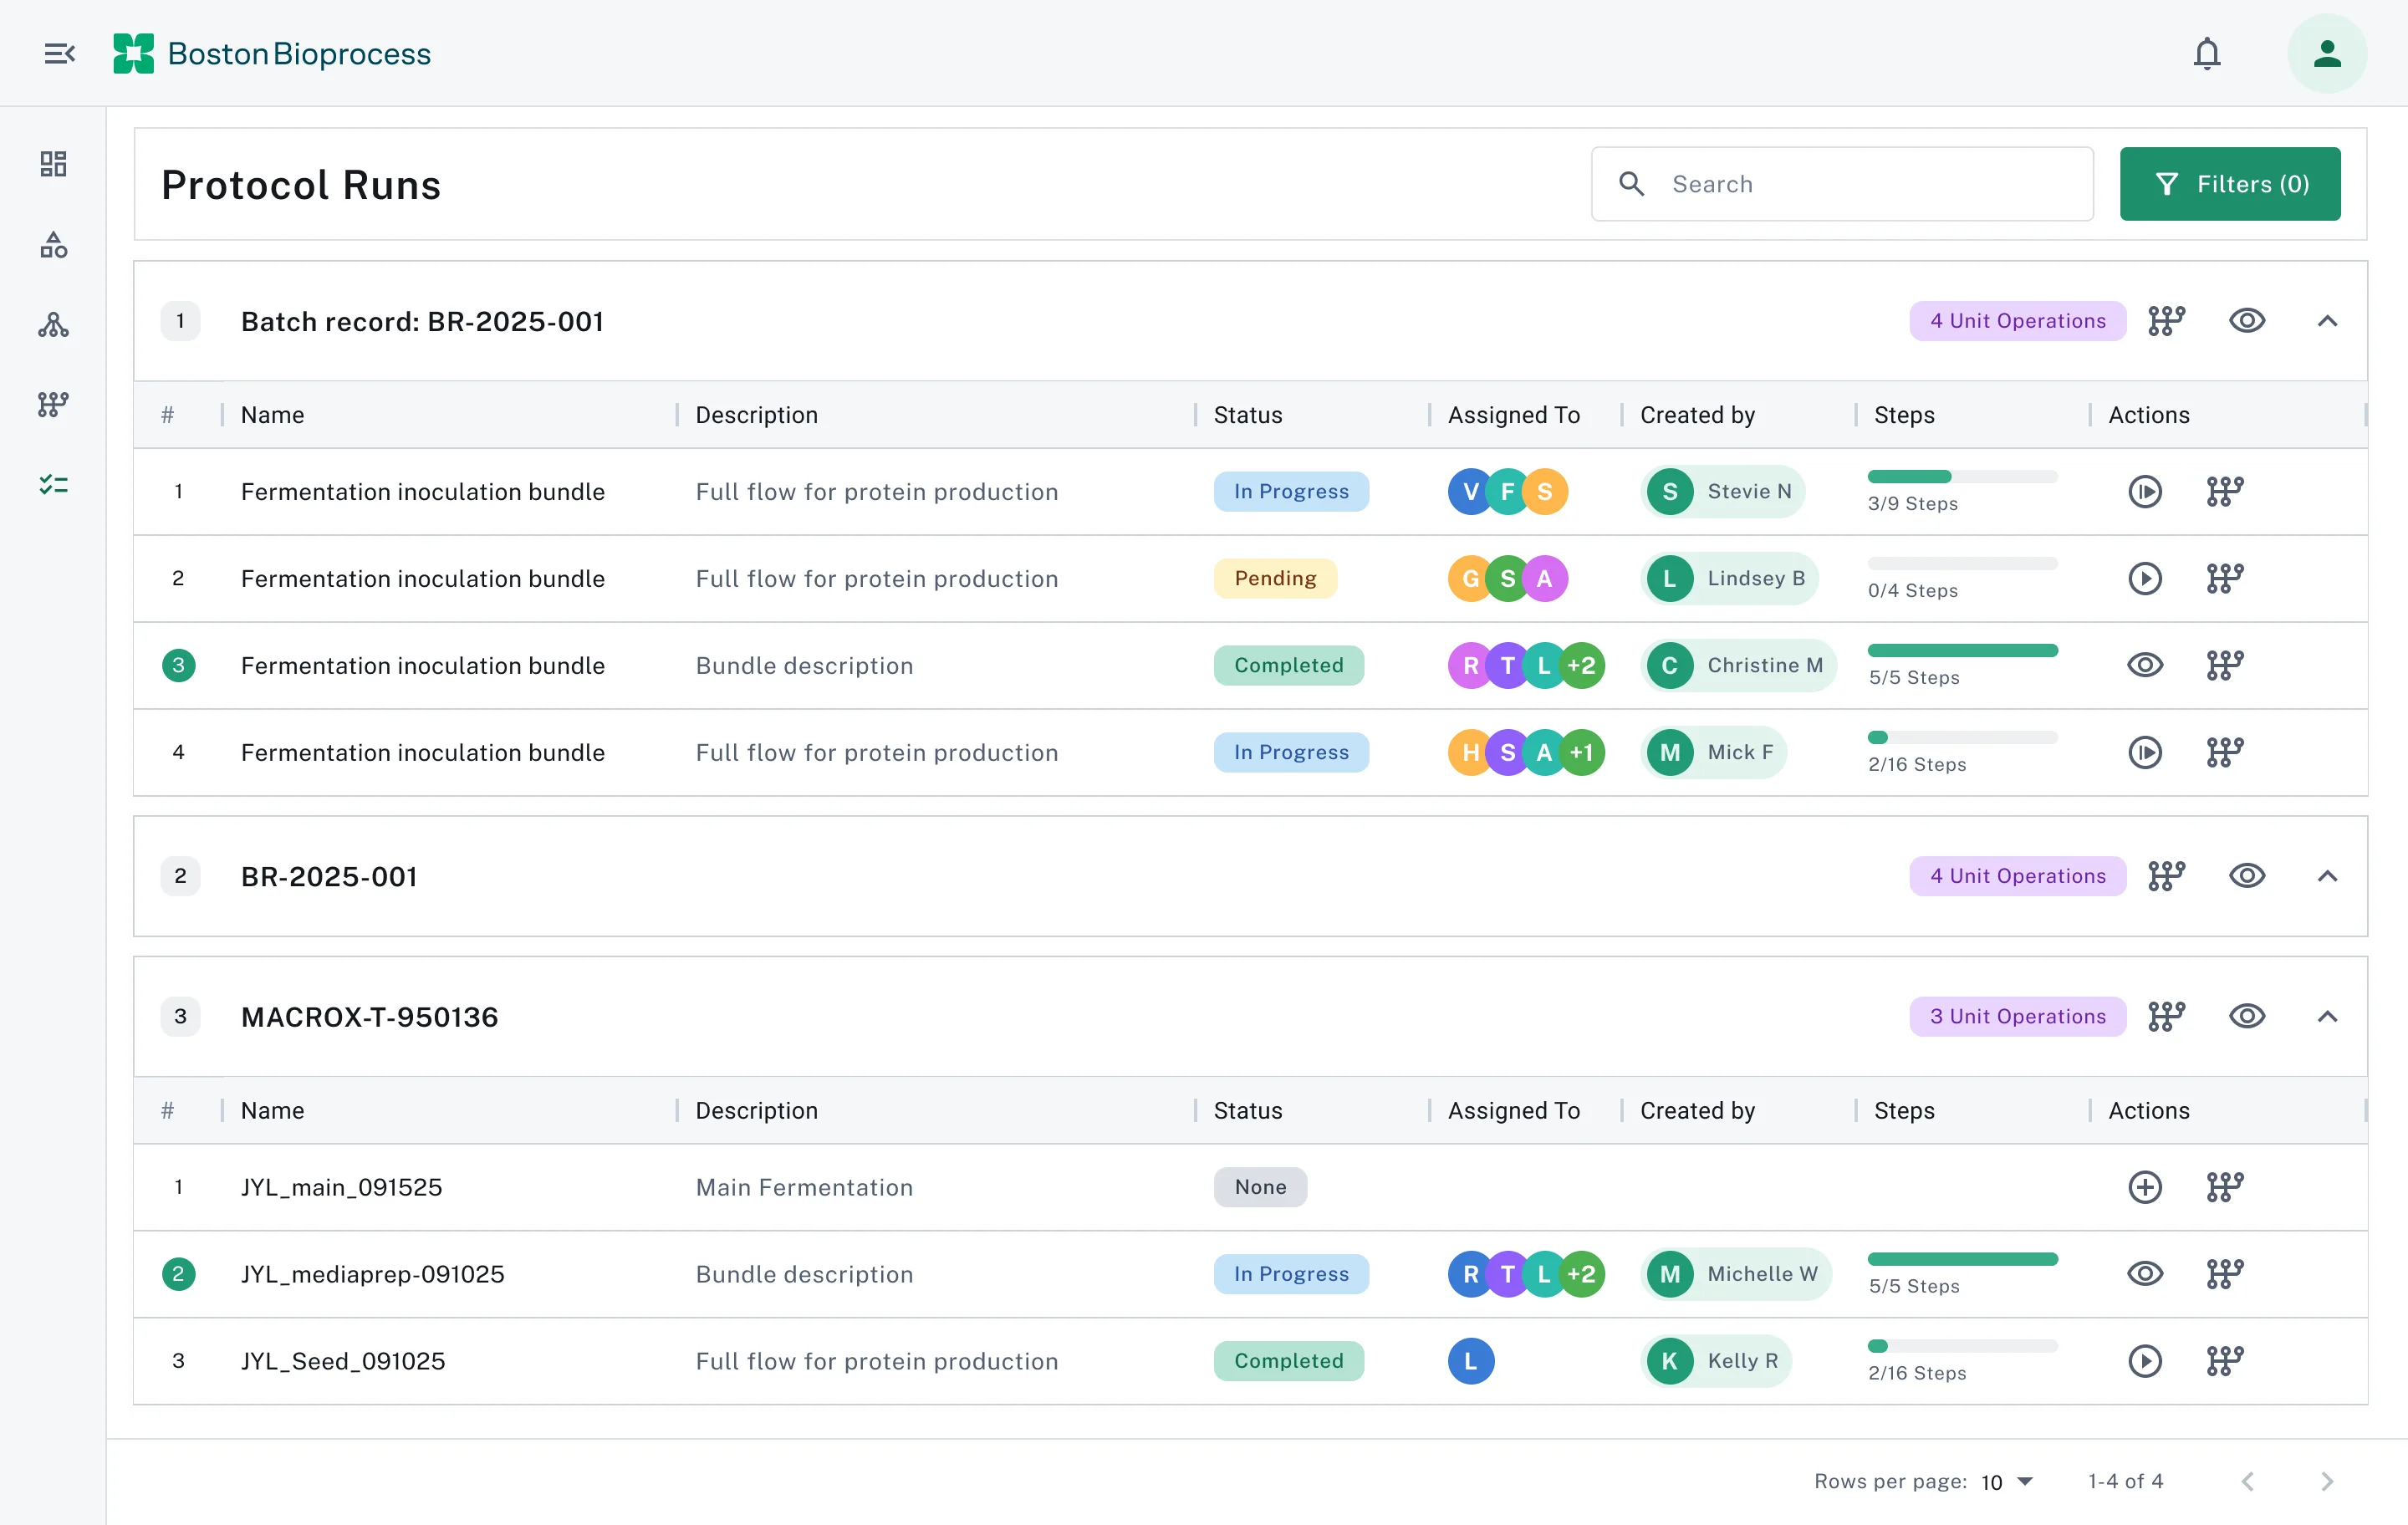
Yanta MES/LIMS
Manufacturing execution system, data manager and AI optimizer in one platform, for fermentation scale-up at Boston Bioprocess.
Six months as a full-stack engineer on Yanta, Boston Bioprocess's manufacturing execution system and LIMS for fermentation plants (React 19, FastAPI, PostgreSQL). I owned the batch-record report builder, the scheduling calendar, the product-wide data grid, Ask AI (an agent that does scientists' work across the product) and the backend test suite, and cut calendar paint time from ~900 ms to under 155 ms.
Problem: A CDMO runs fermentations for competing clients. Every batch has to be planned, executed step by step, traced back to the strain, media and vessel that produced it, and handed over as a report a scientist is willing to sign. Most of that lived in spreadsheets, PDFs and tribal knowledge.
How it was built: Worked across the whole stack: React/TypeScript screens on one shared data grid, FastAPI services and SQLAlchemy models with migrations, a pytest suite that runs against real PostgreSQL on every pull request, and Ask AI, an agent that takes a task from a scientist and carries it out inside Yanta, showing every change for them to keep or undo.
Stack: React 19, TypeScript, TanStack Table, FastAPI, PostgreSQL, SQLAlchemy, Alembic, Playwright, LLM Agents, pytest, AWS
Tags: Product Engineering, React + FastAPI, PostgreSQL, Performance, AI Copilot
Product site: https://yanta.bio
Overview
Yanta is Boston Bioprocess's manufacturing execution system, data manager and AI optimizer in one platform, built for fermentation scale-up, sold to CDMOs and pilot facilities and used to run the company's own plant. Boston Bioprocess runs fermentations for other companies, so the product covers the whole run: create the process flow, track the materials that go into it, execute the protocol step by step, manage the vessels, people and schedule, and analyze the results, with every result traceable to the strain, media, vessel and person that produced it and each client's data kept strictly separate from every other client's.
I was a Software Engineer there from April to October 2026 and worked across the stack: React 19 / TypeScript on the front, FastAPI / SQLAlchemy on the back, AWS underneath. I iterated weekly with the scientists running the plant, turning their review notes into shipped fixes.
The company sells the product on a two-month go-live and an illustrative $82,880 per fermenter per year in saved admin time; those are Boston Bioprocess's marketing figures, not outcomes I measured. What I can speak to is the engineering below.
Architecture
Client (React 19): Strict TypeScript, a shared component library and one virtualized data grid behind every table in the product. The calendar, the report builder and the result graphs are the three big bespoke surfaces.
API (FastAPI): Endpoints validate input, services own the business rules, models own the schema. The API contract is regenerated into the client's TypeScript types on every change, so the two sides can't drift silently.
Data (PostgreSQL): Every client's data is kept separate, because the clients are competing companies. Every record carries a human-readable register ID, so a scientist can point at a mixture or a client without reading a UUID.
Reports + Ask AI: Report PDFs are printed by headless Chromium from one self-contained document, so the preview and the PDF match. Ask AI is an agent that works like a copilot across the product: a scientist gives it a task, and it pulls the run data, builds the charts, fills the notebook and drafts the batch-record report, showing every change for them to keep or undo.
Delivery: GitHub Actions runs linting, the client's unit tests and the backend suite against real PostgreSQL on every pull request, with the backend tests split into timing-balanced shards.
Core Engineering
Batch-record report builder: A paginated, block-based editor scoped to a batch record. Its insert drawer pulls live content: process flow diagrams, sample tables, vessel results, workbook charts and calendar snapshots. Content is copied at insert time (small tables inline, large result graphs as images), so a report doesn't change when its source data does. Export builds one self-contained document, prints it with headless Chromium and returns a download link. The calendar block's editor layout and PDF layout derive the same geometry, so the preview matches the PDF.
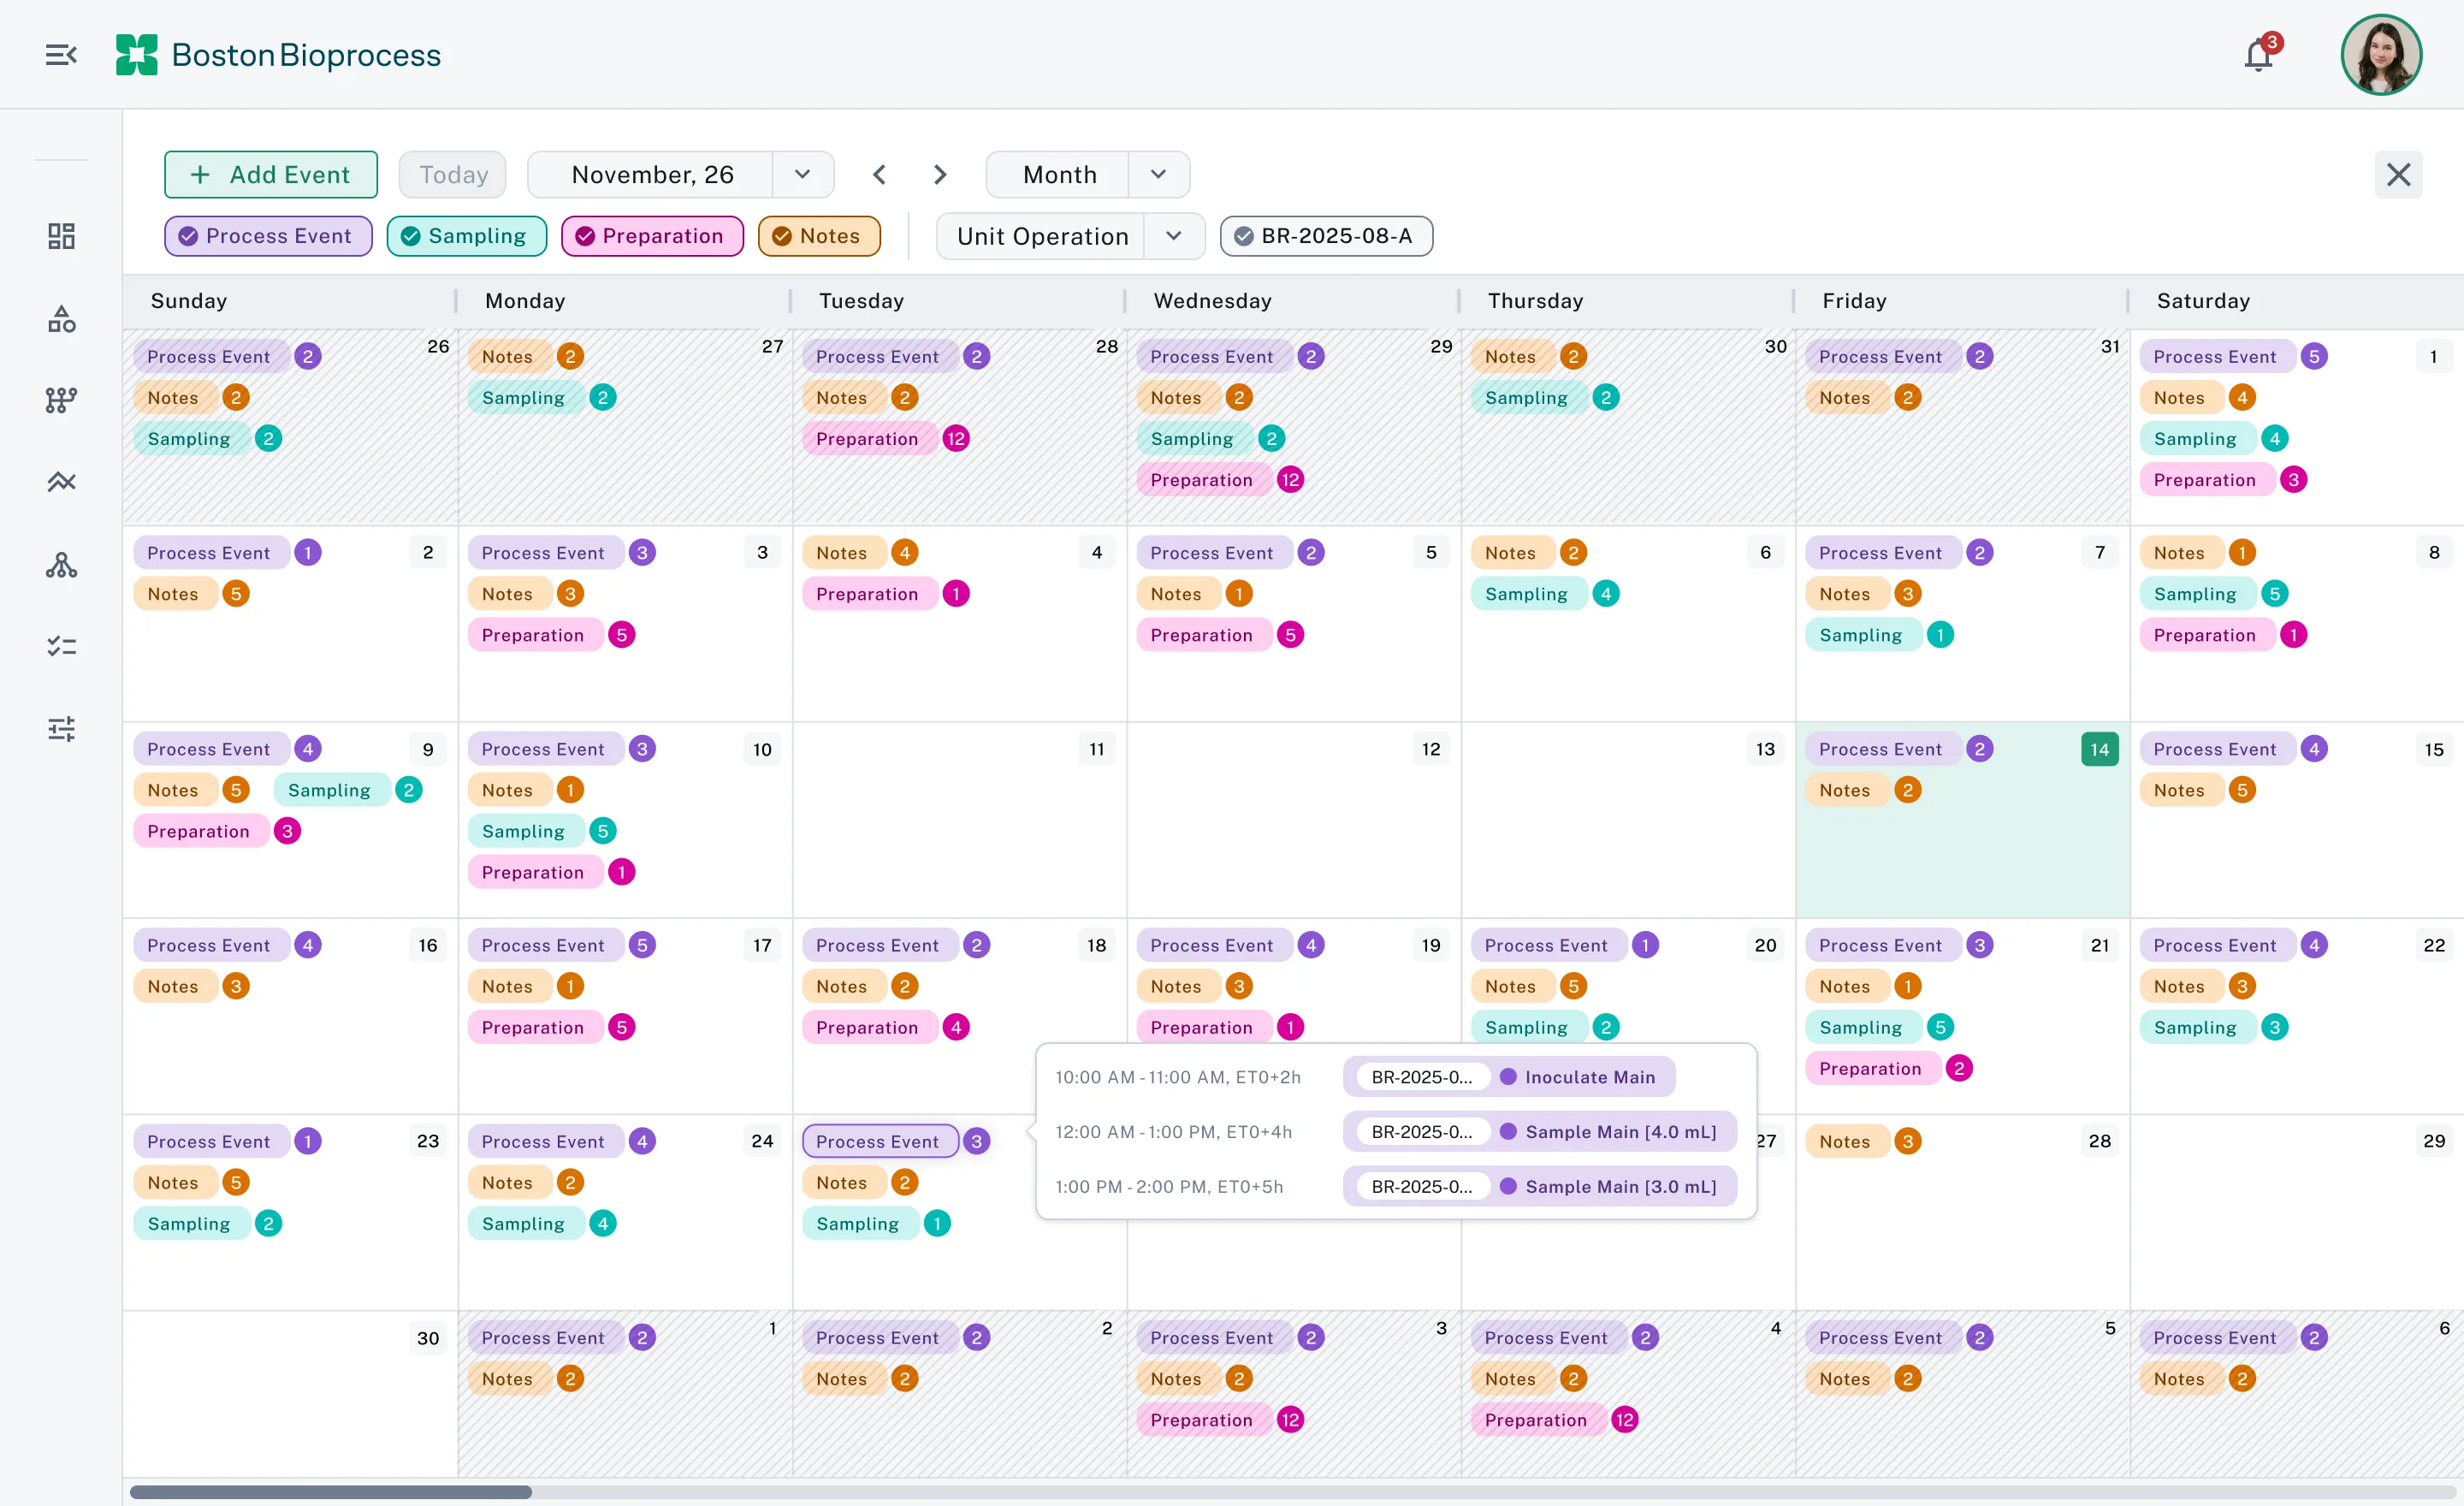
Scheduling calendar: Rebuilt the calendar operators plan fermenter work on: day, week and month views, drag to move or create, Outlook-style copy and paste, linking entries to protocol steps and elapsed times, and assignees with completed-by records. Profiling a real batch record showed each date-range change took 865–947 ms to paint, because an unfiltered view drew one column per unit operation per day; drawing one column per day cut it to 58–153 ms and the DOM from ~40,000 elements to 2,818. On the server, a task's linked-record lookup stopped growing with the number of links, and the columns the calendar filters on got indexes.
Ask AI: an agent that works across the batch: Scientists hand Ask AI a task from wherever they are in Yanta: plan a batch from a template, put its runs on the calendar, reserve the materials, compare this run's titer against the last three, write up the batch record. The agent pulls the run data, builds the charts, creates notebook tabs and cells and drafts the report, and every change it makes is shown to the scientist, who keeps or undoes it. It only ever works inside the signed-in client's own data, and the scientist stays the author of record.
One table layer for the whole app: Replaced every MUI DataGrid with one virtualized TanStack Table grid, then removed MUI from the client entirely. Operators got the spreadsheet behaviour they use for data entry: typed cell editors, range selection, Excel paste and drag-fill, pivot and group-by, density and find, and export on every table. A saved layout can't be overwritten by a second tab, and Designer and Operator column views layer template, site and user settings.
Backend test suite from zero: The server had no automated tests when I joined. I built the first suite as integration tests against real PostgreSQL (no mocks) plus the CI gate that runs it on every pull request; writing it surfaced 4 latent API bugs in the first week. Then I made it fast: parallel workers on cloned databases and timing-balanced shards cut the CI test step from 531 s to 366 s.
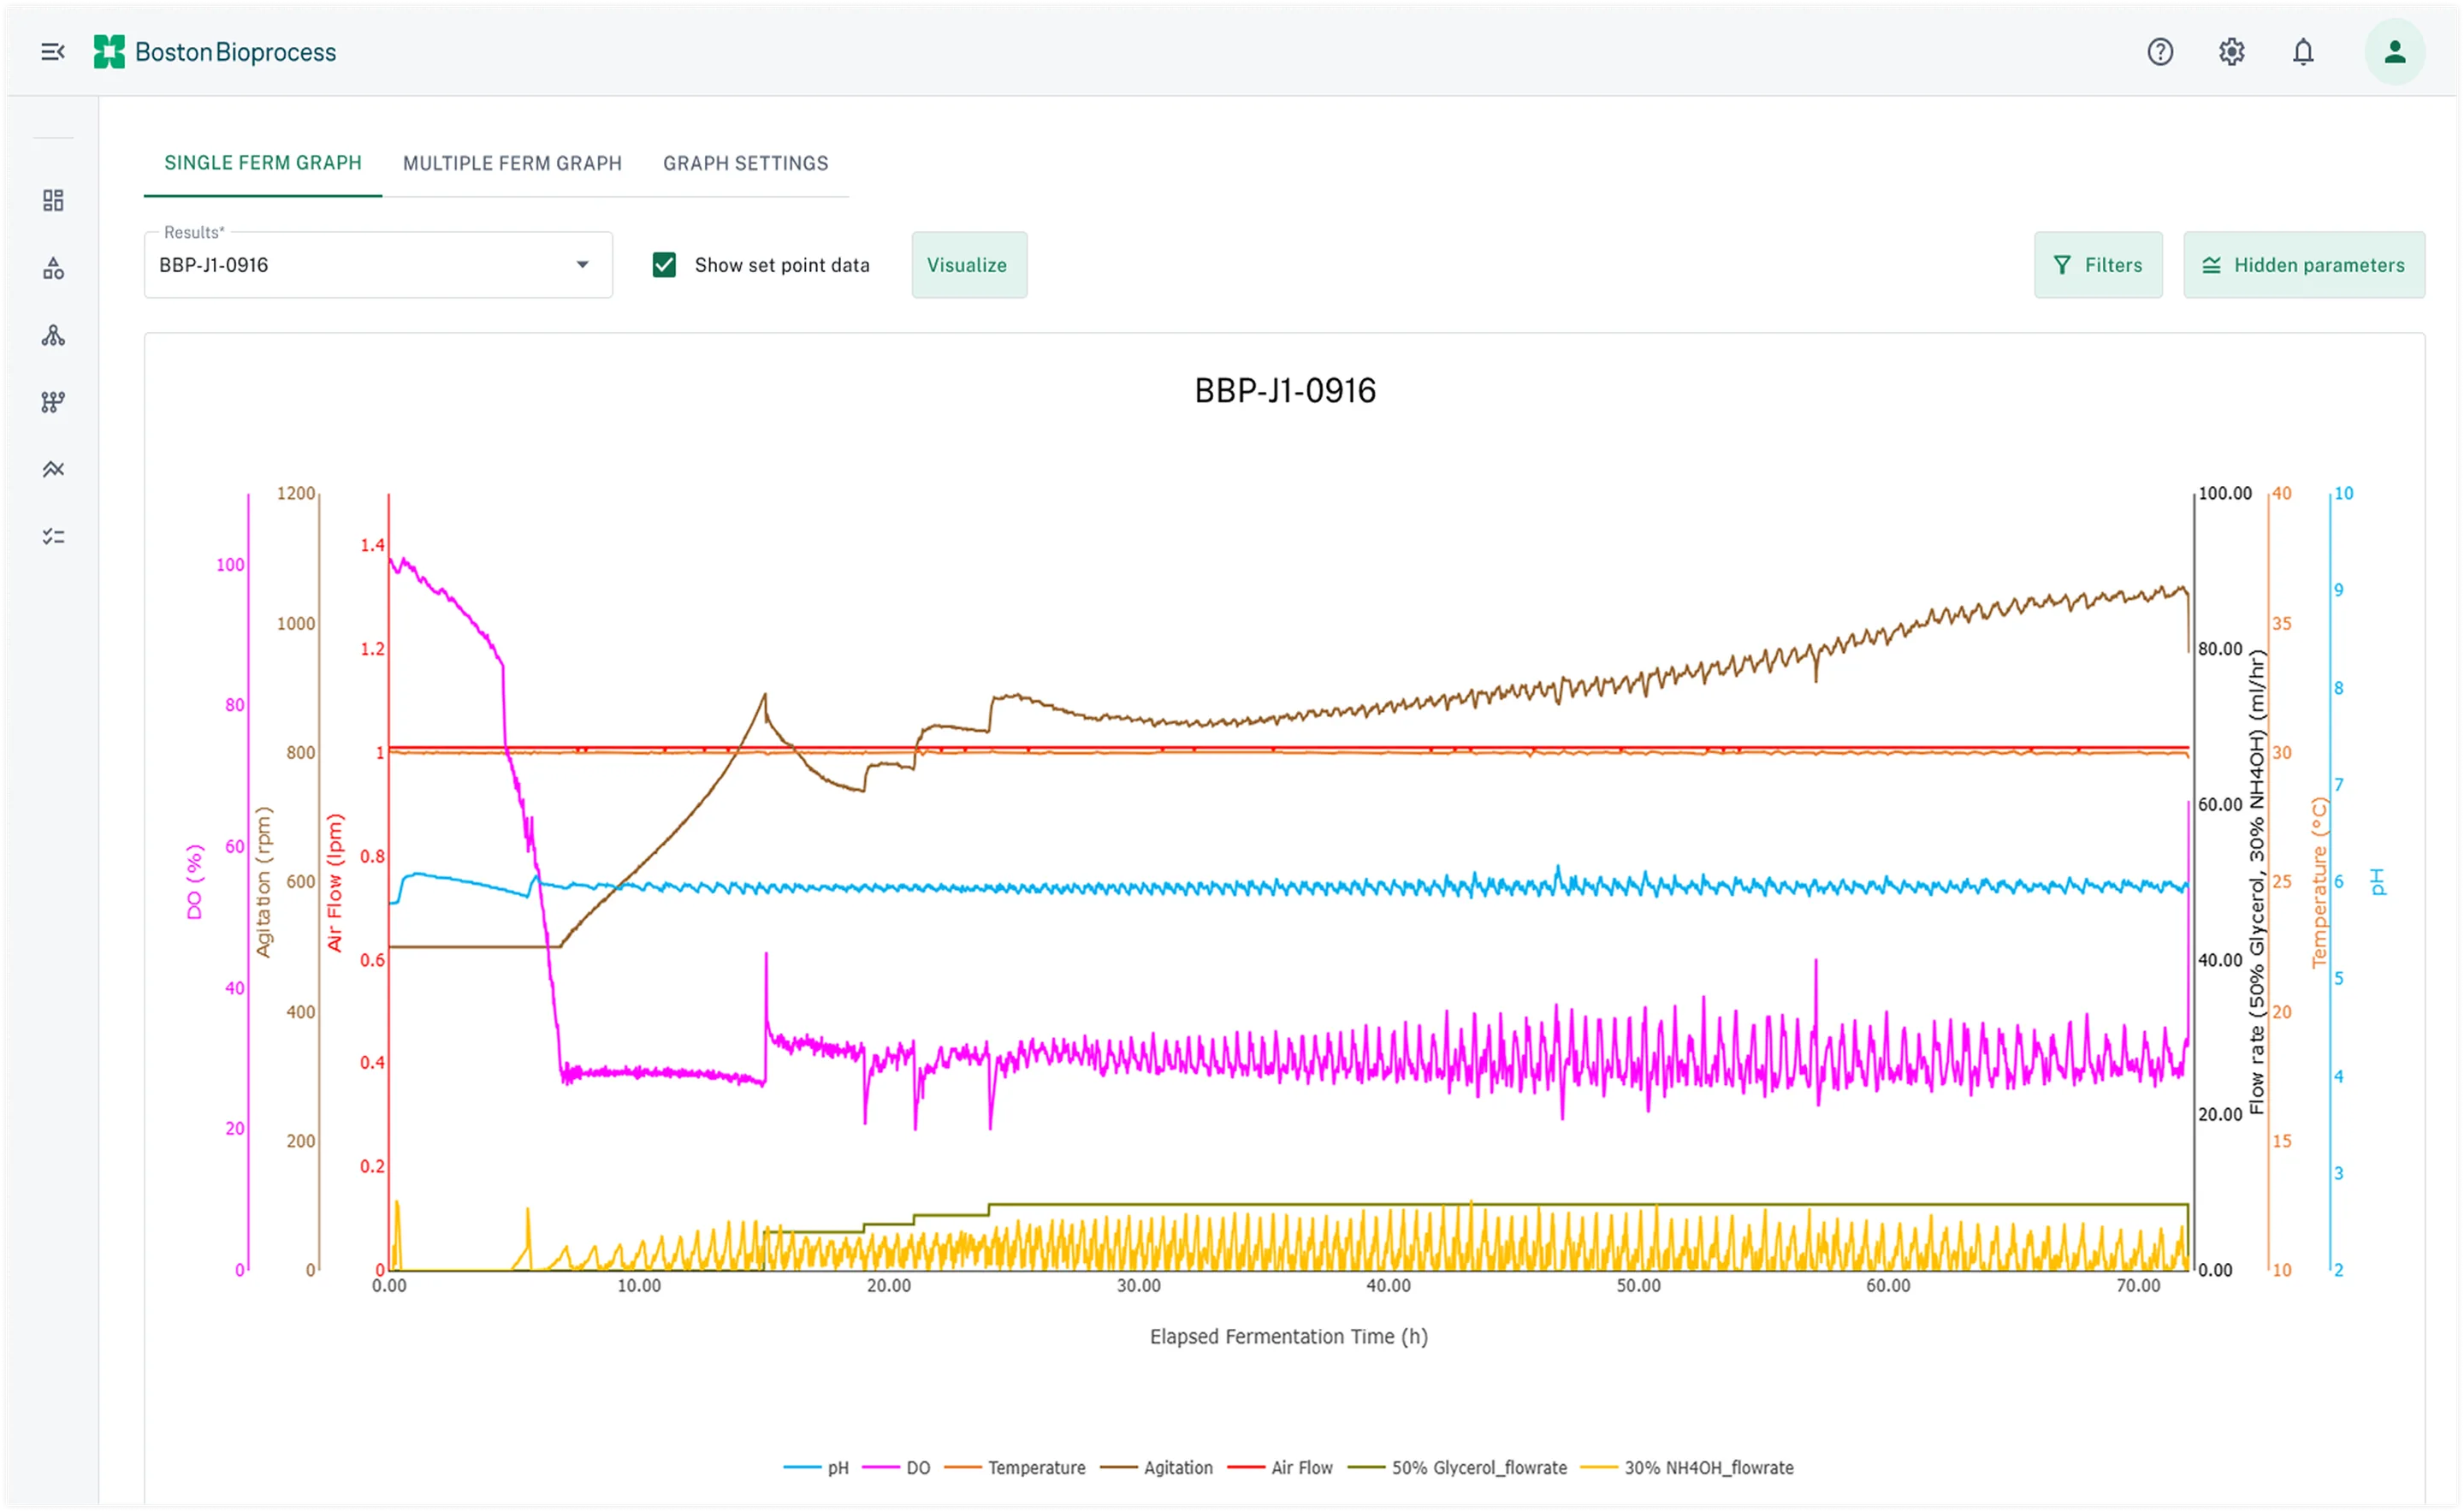
Result graphs: presets, annotations, scales: A local-first graph settings panel and preset library, annotations by x-range and y-parameter drawn as bands above the data, linear / ln / log10 axis scales per parameter that render the same way in the batch-record report, unit-aware axes and nested facet breakdowns. Multi-result edits save in one request instead of one per result.
Inventory, purchase orders and invoicing: Inventory v2 with a purchase-order lifecycle and lot pricing, plus a spreadsheet-style registration grid for materials. CDMO invoicing, built in seven phases: per-use and whole-lot charges, consumable kits with first-expiry-first-out lot allocation, assay-run pricing, statement-of-work lines and discounts, draft review and templates, and validated late-payment terms with a daily task that accrues late fees.
Isolated PDF renderer (built, not merged): To take Chromium out of the API, I built a dedicated renderer on AWS Lambda in an isolated network that can reach only the file store, with infrastructure as code and a CI deploy job. It was finished on a branch but not merged.
Execution Flow
Scientist composes the report: From a batch record, the report builder opens with a pre-filled title block. The insert drawer drills from the process flow to a unit operation to a source (diagram, samples, results, charts, calendar) and drops a block onto the page; the layout autosaves.
Content is copied, not referenced: Small tables land in the report's layout, large result graphs are captured as images, and calendar entries are frozen with the report, so later edits to source data don't change a report someone has already reviewed.
Preview uses the real components: Charts are configured with the same graph components the result pages use, and the calendar block draws the real calendar grid at report scale, so an inserted figure matches what the scientist saw on screen.
Export builds one document: The API lays the blocks out at printable width and inlines every image, so the browser that prints it needs no network access or credentials.
Chromium prints, the file store serves: Headless Chromium draws the charts and prints the page; the PDF is stored with the client's own files and returned as a time-limited download link.
Key Learnings
Snapshot, don't reference. A report that points at live rows silently changes after someone has reviewed it. Copying at insert time (small tables inline, large graphs as images) is what made the report builder trustworthy.
Shared geometry beats pixel-matching. Two renderers that derive layout from the same block data (TypeScript for the editor, Python for the PDF) stay aligned; two renderers tuned by eye drift apart.
Measure what gets drawn before tuning React. The calendar was slow because of layout, one column per unit operation per day, not because of re-renders. Changing what was drawn did more than any memoization would have.
N+1 hides in helper functions. A lookup that issued a few queries per link was invisible at 4 links and expensive at 32; loading each level of the link graph once made it a constant cost.
Ask AI had to be a copilot, not a chat window. Scientists wanted the work done where they already were: in the batch record, the calendar, the notebook, the report. Showing every change and letting them keep or undo it is what made them trust it with a batch.
AgentRamp
The policy execution layer for a US state human-services agency: AI-suggested policy edits decided on the record, a cited caseworker assistant, supervisor oversight and reviewed training.
One of two vendor-side engineers on AgentRamp from April to September 2026, an enterprise policy, training and knowledge platform used by a US state human-services agency. I built Policy Studio's review and publishing flow for AI-suggested edits (each edit's reasoning and cited regulation, accept or deny with an audit trail, version history, publishing only once every change is decided), the Clara assistant's chat (streaming answers with clickable citations, sources that stay attached for follow-ups, feedback and supervisor escalation), Learning Hub review and publishing, notification delivery, role-based access and an accessibility pass. The Policy Studio and Clara work shipped in the July and August 2026 production releases.
Problem: A state agency's policy manual is regulated text that caseworkers act on every day. When an AI proposes edits to it, the staff who own the policy have to see why each edit was proposed and which regulation it rests on, decide every edit on the record, and never publish a half-reviewed version. The same bar applies downstream: a caseworker assistant has to show its sources and hand hard cases to a supervisor, and training modules must only reach learners once reviewers have approved exactly what learners will see.
How it was built: React 19 and TypeScript single-page app on a Hono (Node.js) backend over PostgreSQL, deployed on Azure. I worked across both: the review and publishing workflow and its version history, the collaborative policy editor, the Clara chat's streaming, citations, feedback and escalation queues, the Learning Hub's review and publish rules, notification delivery with retries and outage handling, status-aware access control and a WCAG 2.1 AA pass, with Vitest and database-backed tests.
Stack: React 19, TypeScript, Vite, TanStack Query, TipTap + Yjs, Vercel AI SDK, Hono, Node.js, Drizzle, PostgreSQL, pg-boss, Azure, Vitest, Playwright
Tags: Product Engineering, React + Hono, AI Review Workflows, Cited Assistant UX, Accessibility
Product site: https://agentramp.ai
Overview
AgentRamp is the policy execution layer for state health and human services agencies. Federal rules, the state's policy manual, caseworker guidance, training and QA sit in one connected graph, so when a regulation changes the agency can see which manual sections, answers and training modules it touches, and carry the approved change through to the front line. Policy staff review AI-suggested edits in Policy Studio; caseworkers ask Clara, which answers from the agency's own policy with citations; supervisors oversee those conversations; and training authors turn approved policy into lessons in the Learning Hub. AI suggestions stay drafts until a person approves them.
From April to September 2026 I was one of two engineers on the vendor team building the application for a US state human-services agency. I owned Policy Studio's review and publishing flow and the collaborative editor underneath it, the Clara chat experience and its supervisor tools, Learning Hub review and publishing, notification delivery, role-based access and the accessibility pass. The Policy Studio and Clara work shipped in the agency's July and August 2026 production releases; the Learning Hub work followed a client walkthrough in September.
Everything on this page is described at product level. The screens are recreated with sample data for a fictional agency; no client data, screenshots or names appear.
Architecture
Policy Studio: Where policy staff work. A policy is a set of blocks mapped to the regulations they implement. AI-suggested edits appear as tracked changes with their reasoning and cited regulation beside them; several people edit the same policy at once with live cursors, comments and an edited-by trail; version history keeps every published version and reopens one for the next cycle.
Clara: The caseworker assistant. Answers stream in with numbered citations that open the cited passage, the sources of an answer stay attached to follow-up questions, caseworkers rate answers and the session, and hard questions go to a regional supervisor queue. Answer generation runs in AgentRamp's core platform; I built the chat, the citations, the oversight tools and the analytics around it.
Learning Hub + Training Studio: Training authors generate quizzes, job aids and slides from policy sources, edit them in Office formats in the browser, and send modules for review. Learners only ever see a published, approved version.
Application backend (Hono): A Node.js service on PostgreSQL that fronts AgentRamp's core platform. It owns the editorial workflow and its state machine, the collaboration server, access control, Clara sessions and analytics, and notification delivery.
Delivery and operations: Azure throughout: container apps behind a front door, managed PostgreSQL, blob storage and email delivery, with pipelines promoting develop to QA to production. Vitest suites in the shared, API and web packages, database-backed tests and Playwright.
Core Engineering
Reasoning and citation for every AI edit: Reviewers decide on tracked changes in regulated text, so each suggested edit shows why the model proposed it and the regulation it rests on, with the cited passage highlighted a click away. Before this, most of the reasons the model produced never reached the review screen: on a 56-block policy, the reasons shown to reviewers went from 26 to 53, with none missing.
Accept, deny, and publish only when every change is decided: Each edit is accepted or denied on the record. A denial is sent back to the core platform and kept as a comment, so a denied edit can't quietly reappear, including after a reload. The workflow is a state machine: an illegal jump, such as publishing a draft nobody reviewed, is refused, and Publish only unlocks once every change has a decision, with denials counting as decisions. A window in which a reviewer's decisions could be lost after suggestions were regenerated was closed.
Version history and the next edit cycle: Every published version is kept, a published policy can be reopened for the next cycle, and a reviewer can see what changed between versions. Suggestion generation moved to a background job the screen polls, so a long model call no longer holds a request open and a finished suggestion drops into the page as a single block.
Collaborative policy editing: Several analysts edit one long policy at the same time, with live cursors, tracked changes, AI suggestions as diff marks, comments in place and an edited-by chip, and drafts survive reloads and tabs. The first version doubled a policy's content on every reload because the editor seeded the shared document before its first sync; seeding only after sync fixed it. Viewers see the policy without the suggestions, and unauthorized connections are rejected before any document state loads.
Clara: cited answers, sticky sources, feedback: Streaming answers with clickable numbered citations that open, expand and highlight the cited block. The sources of one answer stay attached to the next question, so follow-ups stay grounded in the same documents, and source documents open from the Sources panel. Thumbs feedback on answers, an end-of-session rating, and archived chats.
Supervisor oversight and analytics: Escalations park unassigned in their region's queue until a supervisor claims them, two supervisors can't claim the same one, and queue depth shows per region. Four role tiers set who may read whose transcripts, every transcript view is logged, and a region-first analytics dashboard drills down to individual caseworkers and exports CSV.
Learning Hub review and publishing: A module's approvals are tied to its content: a substantive edit after approval resets the approval, a module can't be republished when nothing changed, and the published version stays exactly as approved while the author keeps editing the next draft. Review also needs a quiz pass rate set before it starts. Earlier, one authoring flow produced quizzes, job aids and slides, editable in Office formats in the browser and generated into the agency's own branded templates. The review and publishing rules came out of a client walkthrough in September; the fixes shipped within about a week.
Notifications, access control and accessibility: Workflow, comment and Clara events email the right people exactly once, retries back off, and after an outage a backlog of stale 'immediate' mail is suppressed rather than sent late. Access to policy content is decided server-side from the policy's current workflow status. A WCAG 2.1 AA conformance pass added contrast tokens, visible focus, reduced motion, a skip link, landmarks, live regions and keyboard-operable tables; manual assistive-technology QA was still recommended afterwards.
Execution Flow
A regulation changes: Policy Radar lists the incoming source and the policies and blocks it affects; an analyst triages it from the inbox and opens the impacted block directly.
AI suggests edits: Suggestion generation runs as a background job. Each suggestion arrives as a tracked change in the block, with the reasoning and the cited regulation beside it.
Reviewers decide: Each edit is accepted or denied on the record, with comments in place. Denials go back to the core platform and stay in the trail; a denied edit does not come back.
Publish unlocks: Once every change has a decision, the workflow allows publishing. The new version joins the history, and the policy can be reopened for the next cycle.
Caseworkers ask Clara: Answers cite the published policy and the knowledge library, follow-ups keep the sources, and a hard case goes to a supervisor's regional queue.
People are notified: Workflow, comment and escalation events become emails that are delivered once, with retries, and held back if an outage has made them stale.
Key Learnings
The reason has to travel with the edit. Reviewers accept or deny what they can see; surfacing each suggestion's reasoning and citation more than doubled the reasons reaching them (26 to 53) and changed how review happened.
Make illegal states unreachable, not just unlikely. A workflow state machine that refuses bad transitions, and a Publish that only unlocks when every change is decided, removed a whole class of half-published policies.
A denial is data. Sending denials back to the platform and keeping them as comments is what made a denied edit stay denied after a reload.
Approvals belong to the content, not to the module. Resetting approval on substantive edits and freezing the published snapshot is what lets authors keep working without leaking drafts to learners.
Walk through it with the client. The September walkthrough produced the Learning Hub fixes within about a week, and most of them were things no ticket had captured.
Supply Genie
Personal demo of an AI worker for supply-chain exceptions: playbooks that run themselves, a live phone agent, and a person on every customer-facing step.
A personal demo, built while applying to HappyRobot and inspired by how HappyRobot approaches the problem: an AI worker for two supply-chain exceptions, a shipment delay and a worker absence. Webhooks carry an Idempotency-Key, so a retried delivery never opens a second incident; Python playbooks then post to Slack, place Twilio calls and amend the purchase order, and the customer email waits for an operator's approval. A Gemini 2.5 Flash chat and a Gemini Live phone agent request actions through the same command list and approval rule. Not deployed; no users or outcome metrics.
Problem: Supply-chain exceptions such as a late shipment or a missing worker are coordinated by hand across phone, email, Slack and order systems. Handing that work to an AI agent is only safe if a retried webhook cannot open a second incident, a timed-out call is never placed twice by an automatic retry, a purchase order is never silently overwritten, and a customer email never goes out without a person's approval.
How it was built: FastAPI and PostgreSQL backend. Webhooks require an Idempotency-Key, each incident becomes ordered action runs that plain Python executes, customer-facing actions wait as needs_approval rows until an operator decides, and purchase-order writes use a version check. Slack, Twilio and Resend calls run behind per-connector timeouts and circuit breakers, with full-jitter retries, a dead-letter list, manual requeue and an optional PostgreSQL queue worker (SELECT … FOR UPDATE SKIP LOCKED). Gemini 2.5 Flash drives the operator chat through three function tools, and Pipecat bridges Twilio Media Streams to Gemini Live for phone calls, with Redis checkpoints and a per-call command bus. Next.js and React operator workspace.
Stack: FastAPI, Gemini Live, Twilio, PostgreSQL, Pipecat, Gemini 2.5 Flash, Redis, Python, SQLAlchemy, Next.js, React, Slack SDK, Resend, OpenTelemetry
Tags: AI Agent Case Study, Voice AI, Tool Calling, Human-in-the-Loop, Failure Handling
GitHub: https://github.com/RohithReddy20/supply-genie
Overview
Supply Genie is a personal demo of an AI worker for two supply-chain exceptions, a shipment delay and a worker absence. A webhook opens an incident, a fixed playbook turns the incident into ordered actions (for a delay: a Slack alert, a one-way Twilio call that reads the new ETA to the supplier, a purchase-order amendment and a customer email), and an operator workspace shows every step. The customer email waits for an operator's approval. Operators can ask a Gemini 2.5 Flash chat about the incident or tell the chat to run a step, and a separate phone agent streams live calls into Gemini Live. The project was built while applying to HappyRobot and is a conceptual demo inspired by how HappyRobot approaches the problem, not a production system: no users, no deployment and no outcome metrics, and the repo's prompts and UI labels still carry the HappyRobot name. The demo is about the engineering around the model: retry-safe intake, approvals stored as data, versioned purchase-order writes, and failure handling that refuses to auto-retry a Slack post or a phone call when the outcome of the first attempt is unknown.
Architecture
Operator workspace (Next.js): Next.js 16, React 19, Tailwind 4 and shadcn/ui. The incident inbox polls every five seconds and groups incidents into needs-action, escalated and resolved; a playbook strip marks the gated step with a lock; approval cards sit in the center column; an action history shows each step's retries, errors and approval decision; and a chat panel relays questions and commands to Gemini through the API. Every status on screen comes from a database row.
API (FastAPI): Python and FastAPI. The delay and absence webhooks require an Idempotency-Key header; other routes handle approvals, retries, the dead-letter list and requeue, chat, and the Twilio voice webhooks plus the media-stream WebSocket. Middleware stamps a correlation ID on every request and response and stops non-voice requests after 90 seconds (default). The readiness probe reports database health, circuit-breaker states and active calls.
Agents (Gemini): The operator chat calls Gemini 2.5 Flash with three function tools (incident status, shipment lookup, run a command) and loops for up to five tool rounds per message. The phone agent runs Gemini Live with native audio inside a Pipecat pipeline and has five tools, adding call-progress tracking and hang-up. Neither model talks to Slack, Twilio or Resend directly: both agents request incident actions through the same command list, executor and approval rule. After each call, Gemini 2.5 Flash turns the transcript into a structured summary that is saved with the call and posted to Slack.
State (PostgreSQL and Redis): PostgreSQL, through SQLAlchemy and Alembic, holds suppliers, shipments, purchase orders, incidents, action runs, approvals, voice sessions and transcripts. Each step's status, attempt count, request and response payloads and last error live on a single action_runs row, and in queued mode the same table is the work queue. Redis holds only short-lived call state: a checkpoint per active call, with a one-hour expiry by default, and a command list per call.
Connectors and failure handling: Slack (slack-sdk), Twilio (REST calls and Media Streams) and Resend are real integrations; the purchase-order system is a PostgreSQL table with a version column, and the labor (HRIS) system is a mock. Slack, Twilio and Resend calls each run behind a per-connector timeout and circuit breaker. Failed actions retry with exponential backoff and full jitter, then move to a dead-letter list that can be requeued through the API.
Core Engineering
Retry-safe intake and versioned purchase orders: The delay and absence webhooks reject a request without an Idempotency-Key header (422). A known key returns the existing incident with 200 instead of 201, so a sender that retries never opens a second incident or runs the playbook twice, for example calling the contractor agency twice for a single absence. When two requests race with the same new key, a unique constraint lets a single insert through; the losing request rolls back and returns the winning incident. Purchase-order amendments use a version compare-and-swap instead of a lock: the UPDATE bumps the version and only matches while the version is unchanged since the read, so a concurrent edit produces a conflict error rather than an overwrite.
Playbooks run by plain Python: A playbook is a Python list, so a delay always becomes four action runs (Slack alert, supplier call, PO amendment, customer email) and an absence three (labor-system update, contractor call, site-manager alert in Slack). A deterministic executor walks the runs in sequence order, sends each pending action to the matching connector, saves the request and response payloads on the row, and writes every action in a separate database transaction, so a later failure cannot roll back an earlier PO change. An incident resolves once every run is completed or skipped, and escalates when any run is dead-lettered. No model decides what a playbook does next.
Approval gates stored as rows: A customer-facing action, here the customer email, is created as needs_approval next to a pending row in the approvals table, under a setting that is on by default. The gate follows the action type, not a model's sense of risk, and neither agent has a tool that approves. A decision is a single UPDATE that only matches while the approval is still pending, so a double click or a racing request gets 409 instead of a second email. Approving moves the action to pending and dispatches the action; rejecting marks the action skipped. Asking either agent to email the customer produces a gated approval instead of an email.
Failure handling per connector: Slack, Twilio and Resend calls each run behind a dedicated timeout (defaults: 10 s, 15 s and 10 s) and a circuit breaker that opens after five straight failures, lets calls through again after 60 seconds and closes after two successes (defaults). A failed action retries with exponential backoff and full jitter (200 ms base, 10 s cap) and is dead-lettered after the third failed attempt, with a fallback note stored on the row. Timeouts get stricter treatment: a timed-out Slack post, Twilio call or manager alert may still have gone through, and no idempotency key reaches Slack or Twilio, so the action goes straight to the dead-letter list for a person to check. Email stays retriable because every attempt sends Resend the same idempotency key. Dead-lettered actions can be listed and requeued through the API.
A PostgreSQL queue, and no durable engine yet: By default, actions run inline, inside the API request that created or approved the actions. With queued mode switched on in configuration, the actions are marked queued instead, and a background worker claims the oldest queued action with SELECT … FOR UPDATE SKIP LOCKED, runs that incident's queued actions, and requeues failed actions once the backoff window has passed. A queue-status endpoint reports queue depth, retriable and dead-lettered counts, and worker health. A written evaluation in the repo compares the queue with a durable workflow engine such as Temporal and recommends keeping the queue until defined adoption gates are met; selecting the durable mode of the workflow-engine interface raises an error on purpose.
Live phone agent: Twilio, Pipecat, Gemini Live: Inbound calls, and outbound calls started through the voice API, get TwiML that opens a Twilio Media Stream to a WebSocket on the backend. A Pipecat pipeline converts the 8 kHz telephone audio and streams the audio to and from Gemini Live, with Gemini's voice-activity detection tuned (high start and end sensitivity, 260 ms of silence to end a turn; defaults). When the caller talks over the agent, a custom Pipecat processor sends Twilio a clear event so buffered agent audio stops playing. The agent marks four call objectives (cause, new ETA, mitigation, risk) through a tool and closes the call after a brief closing statement once all four are confirmed; the transcript is saved and summarized into Slack. The playbook's supplier and contractor calls are different: one-way Twilio calls that read a fixed message.
Operator chat with Gemini tool calling: The chat panel sends the operator's message, the conversation so far and a snapshot of the incident to Gemini 2.5 Flash with three function tools: get_incident_status, list_active_shipments and execute_command. The backend runs each tool call and returns the result to the model, for up to five rounds per message. The execute_command tool accepts only a fixed list of commands: internal steps run immediately through the same executor as the playbook and report success or the connector's error, while a request to email the customer becomes an approval card instead of an email. Status answers are grounded in the action rows, because get_incident_status returns each step's status and last error.
Call control from any server: Groundwork for running several backend servers, built but never deployed to more than a single server. Each active call records the owning server's ID and a heartbeat, and checkpoints state to Redis every five seconds and on each progress or end-call tool call: objective flags, close state and the transcript tail, with an expiry. A control command (only end_call is supported) runs locally when the call lives on the receiving server; otherwise the command goes onto a per-call Redis list that the owning server polls every second. Routing fails closed: no Redis bus returns 503, no checkpoint returns 404, and a checkpoint older than 20 seconds returns 409 (timings are defaults). Kubernetes and NGINX sticky-routing templates and a multi-pod smoke-test runbook are in the repo; the smoke test has not been run.
Execution Flow
Webhook opens an incident: An upstream system posts a shipment delay with an Idempotency-Key. A repeated key returns the existing incident with 200. A new key creates the incident and four action runs in one transaction, with the customer email stored as needs_approval next to a pending approval.
Internal steps run in order: The executor, inline by default or in the queue worker, posts the Slack alert, places the one-way supplier call and amends the purchase order with the version check. Each step is saved in a separate transaction and recorded as an OpenTelemetry span.
Failures stay contained: A failed step stores the error and the next retry time. Retries use jittered backoff and come from the queue worker or the Retry failed button in the workspace. A timeout on Slack or Twilio dead-letters the step at once; a third failure dead-letters the step and moves the incident to Escalated in the inbox. Dead-lettered steps are requeued through the API.
The gate waits for a person: The workspace marks the email step as awaiting approval and shows an approval card in the center column; the operator can ask the chat for a status summary first. Approve sends the email through Resend with the action's idempotency key; Reject marks the step skipped. A second decision on the same approval gets 409.
A live call, when needed: Separately from the playbook, a call into the Twilio number, or an outbound call started through the voice API, reaches the Gemini Live agent. The agent reads incident status, can request a step through the same approval rule, and leaves a structured summary in Slack after hang-up.
The incident resolves: Once every action is completed or skipped, the incident is marked resolved and moves to Recently resolved in the inbox. Each step's payloads, errors and approval decision stay on the action and approval rows.
Key Learnings
Keep the model out of the failure path. Gemini picks from a fixed tool list, and plain Python owns retries, breakers, timeouts and state changes. A bad model turn can request the wrong step, but cannot approve a customer email or change how failures are retried.
Idempotency belongs at the edge, before any side effect. A required header plus a unique constraint stop a retried webhook from opening a second incident and calling the same contractor agency twice.
An approval is a row, not a prompt. A needs_approval status plus a compare-and-swap on the decision means a double click returns 409 and the customer gets a single email; a prompt telling the model to ask first would guarantee neither outcome.
A timeout means unknown, not failed. A Twilio call that timed out may still ring, so a non-idempotent connector should stop and hand the action to a person; email can retry because every attempt sends Resend the same idempotency key.
Adopting a durable workflow engine is a decision with entry criteria. The repo's evaluation keeps the PostgreSQL queue until at least one adoption gate holds: workflows that regularly run past 30 minutes with timers, compensation across more than three external systems, worker restarts that keep needing manual fixes, or audits that need replayable history.
Vestra Assets
Next.js review workspace that turns financial statements into checked, exportable transaction data.
Frontend owner and backend contributor on Vestra Assets, a web app turning financial statements into reviewable transaction data (Next.js 16 in a Turborepo; Flask on Firebase Cloud Functions). Built the review workspace from upload to CSV export, Firebase sign-in with an admin-role gate, and password-protected PDF handling across both codebases. Virtualizing the transaction table, together with memoized category lookups, cut first render of a synthetic 10,000-row statement from 2,017 ms to 39 ms in a lab benchmark.
Problem: OCR on financial statements can't be fully automatic. Flagged values have to be found, checked against the source page and corrected quickly, even on statements with long transaction lists. Bank statements also often arrive password-protected, and without an unlock path such files dead-end the pipeline.
How it was built: Two Next.js 16 apps (OCR review and admin) in a pnpm Turborepo, sharing shadcn/ui components, CSS-variable design tokens, a typed API client and a Zustand auth store; TanStack Query for server state and TanStack Virtual for the transaction table; Firebase Authentication with route guards and bearer tokens on API calls. On the Flask backend (Firebase Cloud Functions, Firestore, Cloud Storage): pikepdf-based unlocking of password-protected PDFs with race-safe Firestore claims and pytest coverage, a categories module, and validation for CPF statements.
Stack: Next.js, TypeScript, Turborepo, Flask, Firebase, TanStack Query, TanStack Virtual, Zustand, Tailwind CSS, shadcn/ui, pikepdf, Vitest, pytest
Tags: Frontend Engineering, Next.js + Flask, OCR Review UI, Performance, Firebase Auth
Overview
Vestra Assets turns uploaded financial statements into structured, reviewable transaction data. The extraction pipeline, built by a teammate on Flask and Firebase Cloud Functions, classifies each document with an OpenAI model, extracts every page as a separate chunk with Reducto, checks the extraction against the page image with an LLM, and rolls up a confidence score, flagging documents for human review. Between January and August 2026, I owned the frontend: a Turborepo with two Next.js apps, an OCR review app and an admin app, covering upload, processing status, split-pane correction against the source PDF and export, plus Firebase sign-in with an admin-role gate. On the backend: the server half of password-protected PDF handling, a categories module, and validation for CPF statements (Singapore's state savings scheme).
Architecture
OCR review app (Next.js 16): App Router app served under /app/ocr: upload, the document list, document detail and the split-pane correction workspace. TanStack Query holds server state and polls files still in progress, TanStack Virtual renders the transaction table, and react-resizable-panels splits the correction view.
Monorepo (Turborepo + pnpm): Two Next.js apps over shared packages: @repo/ui for shadcn/ui components and CSS-variable design tokens, @repo/shared for the API client, query hooks, types, Firebase config and a Zustand auth store. The admin app sits at the root and rewrites /app/ocr/* to the OCR app, so both apps share one domain.
API (Flask on Cloud Functions): Flask blueprints registered through one registry and served from Firebase Cloud Functions; the client sends the signed-in user's Firebase ID token as a bearer token. Contributions here: the categories module, CPF result validation, and the unlock route and Firestore claims for password-protected PDFs.
Extraction pipeline: Built by a teammate; context for the review UI. A Storage trigger and Firestore triggers move each file through preprocessing, classification with an OpenAI model, per-page extraction with Reducto, an LLM check against the page image and a rollup. The rollup flags a document for review when confidence falls below 98, transaction accuracy below 98%, or the balances don't reconcile.
Data (Firestore + Cloud Storage): Firestore holds file status, QA scores and categories; Cloud Storage holds uploads, page chunks, extraction results and the unlocked copy of a protected PDF. Browsers upload and view PDFs directly through expiring signed URLs.
Core Engineering
Split-pane correction workspace: Resizable panes put the correction panel beside the source PDF. Metadata issues, flagged transactions and rows the pipeline found missing share one issue list with a navigator. Selecting an issue loads the issue's source page into the PDF pane, and an expired signed URL can be refreshed in place without losing the page. Missing rows open a form pre-filled from the detected row, and fixes save per issue or all at once.
Virtualized table, paginated lists: The transaction table mounted every row and resolved each category label by scanning the category list. Moved the table to TanStack Virtual (fixed row height, an overscan of 10 rows, a scroll to the edited row when editing starts off screen) and replaced the scans with memoized lookup maps. A later lab benchmark of that change against the previous version, on a synthetic 10,000-row statement: first render fell from 2,017 ms to 39 ms, the DOM from 265,030 to 596 nodes, JS heap from 328 MB to 12.5 MB, and long tasks during a full scroll from 1,387 ms to none. The gain is virtualization and memoization together. Document lists got server-side pagination over the backend's cursors, plus infinite scroll.
Password-protected PDFs, end to end: Before this work, encrypted PDFs stopped at a requires-action status with no way forward, including PDFs carrying only permission restrictions. Rebuilt the flow around pikepdf: preprocessing rewrites permission-only encryption as a plain copy without prompting, so only a real password stops a file. The unlock route decrypts into a separate processed copy, never stores the password and resumes processing; a wrong password gets a 422 and the file stays blocked. Unlock and delete each claim the file in a Firestore transaction first, so a delete can't race a decrypted upload. The UI takes passwords during upload or later from the document list, one shared password or one per file, with pytest and Vitest covering the failure paths.
Upload to export: Files upload straight to Cloud Storage through signed URLs with per-file progress, then wait for an explicit process step. Polling asks only about files still in progress, every 3 seconds, and merges the answers into the list. A finished document can be re-extracted, corrected, deleted singly or in bulk, and exported as a CSV or as a ZIP holding a metadata CSV plus one transaction CSV per category.
Schema-driven editors per statement type: Transaction fields for bank, credit-card, mortgage and CPF statements are defined once in the shared package, and the correction panel renders the editor from those definitions, down to CPF rows carrying a separate amount per CPF account. Other types, including payslips and income-tax statements, fall back to a generic view.
Firebase sign-in and an admin-role gate: A shared AuthProvider and Zustand store connect Firebase Authentication to both apps. AuthGuard sends signed-out visitors to the login page with the original path attached; AdminGuard also sends non-admins from the admin app to the OCR app. API calls carry the signed-in user's Firebase ID token as a bearer token. The admin app adds invitations, user and role management, and category management. The guards are client-side; server-side role checks belong to the backend.
Monorepo and design tokens: Set up the Turborepo with pnpm, two Next.js 16 apps, shared packages and an app switcher between the apps. Design tokens are CSS variables in one tokens file, documented as the single source of truth and used by the shared shadcn/ui components. The OCR app runs under a /app/ocr base path and the admin app at the root rewrites /app/ocr/* to the OCR app, putting the two apps on one domain. Each app has a Vercel config with a turbo-ignore check, skipping a build when nothing the app depends on has changed.
Backend: categories and CPF validation: Built categories end to end: a Flask blueprint with create, read, update and delete for categories and sub-categories in Firestore, registered through the backend's blueprint registry; a merger step mapping every extracted transaction's sub-category to a main category; the category pickers in the transaction table; and the admin screen for managing categories. Also extended the validation run on saved corrections to accept CPF transactions, with amounts split across three CPF accounts instead of a single amount field.
Execution Flow
Upload: Files go straight to Cloud Storage through signed upload URLs with per-file progress, then sit in an uploaded state until the process step is triggered.
Process: The backend pipeline preprocesses each file, classifies the document, extracts every page as a separate chunk, checks the extraction against the page image and rolls up a confidence score. A PDF needing a password stops at preprocessing until unlocked; the UI polls only files still in progress.
Triage: Documents with a confidence score under 98 (of 100), transaction accuracy under 98%, or credits minus debits not matching the change in balance come back flagged for review. The status card shows the score, the accuracy and the flag, and the document list filters on the flag.
Correct: An issue opens from the issue list or from a row in the transaction table, with the source page loaded in the PDF pane. Fixes go into the typed editor and missing rows into a pre-filled form; saving sends the corrected document back, where the backend validates the edit and recalculates the score.
Export: A finished document downloads as a CSV, or as a ZIP with a metadata CSV and one transaction CSV per category.
Key Learnings
Measure at the time, not afterwards. The table was virtualized in February 2026 and only benchmarked in October, against the previous version on a synthetic 10,000-row statement. The gains were large but are lab numbers from one machine, with virtualization and memoized lookups measured together.
Virtualizing an editable table is more than a rendering change. The overscan of 10 rows was set for edit safety as well as smooth scrolling, and the table scrolls to a row when editing starts off screen. A fixed row height keeps the math simple but costs flexibility for wrapped descriptions.
Claim before mutating. Unlock and delete act on the same stored PDF, so each first claims the file in a Firestore transaction. A delete can't remove a file mid-unlock, a failed unlock restores the password-required state without overwriting a newer status, and tests cover both orderings.
Older records need the new path too. Files recorded as failed with a PROTECTED error code still had to reach the unlock action, so the UI folds those records and requires-action files into one status, with Vitest tests on the mapping and the document-list filter.
Client-side guards are navigation, not security. AdminGuard only redirects non-admins; the real check is role enforcement in the API, and admin-only routes need server-side tests to match.
Reft
Drag-and-drop builder for document-AI pipelines: background runs, models compared side by side, and an assistant that edits the canvas.
A personal project, built solo from December 2025 to February 2026: a drag-and-drop builder for document-AI pipelines. A file source, Unstructured partitioning, PDF splitting, schema-based extraction and an output node are wired on a React Flow canvas, and Celery workers run the graph in dependency order. Extraction nodes that share a source run in parallel, so Mistral and Gemini output can be compared side by side or as a diff, and a chat assistant builds or edits the pipeline through validated canvas actions.
Problem: Running one document through several AI models and comparing the results takes a chain of steps (partitioning, page splitting, schema extraction), and each provider accepts files and JSON schemas differently. The goal was a Zapier-style builder for document AI: draw the chain once, run the graph in the background, and read each model's answer side by side.
How it was built: The backend started from the open-source FastAPI Best Architecture template (MIT), which supplied JWT login, RBAC, the admin layer and Celery wiring. Built on top: the pipeline, run and upload APIs, the Celery task that executes the graph, Mistral, Gemini and OpenAI adapters behind one interface, Azure Blob and local storage, and a LiteLLM-backed assistant. The frontend and the design system were built for Reft with React 19, TanStack Start, React Flow, Zustand, TanStack Query and pdf.js. Deployed with Docker Compose on an Azure VM behind Caddy, with the frontend on Netlify and a self-hosted Unstructured API on a second VM.
Stack: React 19, React Flow, FastAPI, Celery, PostgreSQL, Redis, TanStack Start, Unstructured, Mistral OCR, Gemini, LiteLLM, Docker Compose, Azure
Tags: Document AI, React Flow, FastAPI + Celery, LLM Tools, Design System
Overview
Reft is a drag-and-drop builder for document-AI pipelines, built solo as a personal project between December 2025 and February 2026. A pipeline is drawn on a canvas (a file source, Unstructured partitioning, PDF splitting, schema-based extraction with Mistral, Gemini or OpenAI, and an output node) and runs on Celery workers in the background. Extraction nodes that share a source run in parallel, so two models' answers can be compared field by field, and a chat assistant builds or edits the pipeline from a plain-English request. The backend started from the open-source FastAPI Best Architecture template (MIT), which supplied login, RBAC and the admin layer; the pipeline, assistant, provider and Celery-task modules, the frontend and the design system were built for Reft. What came next: REFT v2 (July 2026; built locally, unpublished) gave every extracted field a page and source quote, checked the fields with deterministic Python rules and sent only failing fields back for repair. The same evidence-first idea is now public in docextract, measured at value F1 0.913 across all 370 ExtractBench documents.
Architecture
Client (React 19 + React Flow): TanStack Start and Router, a React Flow canvas, Zustand stores for the pipeline and the assistant, TanStack Query for data and run polling, and pdf.js for document previews, styled with Tailwind 4 and Radix primitives in the Reft design system. Hosted on Netlify, which proxies API calls to the backend.
API (FastAPI on an MIT template): The backend started from the open-source FastAPI Best Architecture template, which brought JWT login, RBAC, the admin layer and Celery wiring. Added on top: pipeline, run, upload, result and comparison endpoints and the assistant endpoint, all behind JWT auth, with every pipeline and run checked against the signed-in owner. Served by Uvicorn behind Caddy (automatic HTTPS) in Docker Compose on an Azure VM.
Workers (Celery + Redis): A single Celery task, execute_pipeline, turns the saved canvas JSON into a graph, orders the nodes with Kahn's algorithm (a cycle fails the run) and runs every node on the outputs of upstream nodes. Run state lives in PostgreSQL, with per-node success and any error message stored on the run.
Models (Mistral, Gemini, OpenAI): Extraction adapters share one interface: declared capabilities, OCR and schema-constrained extraction. Mistral OCR fills a JSON schema in a single annotation call, Gemini 2.5 Flash reads the PDF directly and answers in JSON-schema mode, and GPT-4o reads images under a strict schema. Unstructured partitioning runs as a self-hosted API on a dedicated Azure VM, and the assistant reaches any model through LiteLLM.
Data (PostgreSQL 16 + Azure Blob): A pipeline is one row holding the canvas (nodes and edges) as JSONB. A run row records status (pending, processing, completed, failed), output files per provider, a JSONB result summary and the error message, indexed by pipeline and status and by user and time. When Azure is configured, source uploads and single-run inputs and outputs are stored in Azure Blob Storage and shared through read-only signed links; otherwise a local volume is used.
Core Engineering
Canvas with typed connections: Nodes come from a palette grouped into sources, processors, enrichments and destinations, and every node type has a dedicated settings form: Unstructured strategy and OCR languages, pages per split and image DPI, provider, model and output schema. One table of allowed links decides which node types may connect; React Flow rejects any other drag, and the store applies the same table to edges the assistant adds. Saving checks for exactly one source, no unconnected nodes and every node configured, and the API re-checks the source and destination counts.
Schema builder: Extraction output is defined in a schema builder with a visual mode (string, number, boolean, array and object fields; date, email and URI formats) and a JSON mode, synced both ways and validated as fields change. Templates cover invoices, receipts, contracts, purchase orders, bank statements and ID documents.
Background runs and failure handling: Pressing Run validates the upload (PDF, PNG, JPEG, TIFF, BMP or WebP, up to 100 MB), creates a pending run, queues execute_pipeline and answers at once with the run ID; the editor polls every two seconds until the run completes or fails. The Mistral and Gemini adapters retry dropped connections in-process, a 429 or 5xx from Unstructured sends the task back to Celery for another attempt, and any other error fails the run with the message saved. Inputs are kept, so failed runs can be re-run one at a time or in bulk from the Jobs page.
Parallel extraction and comparison: When two or more extraction nodes hang off the same file or splitter, the worker launches the extraction calls together with asyncio.gather, and the synchronous Mistral and Gemini SDK calls run in threads (asyncio.to_thread) so the requests overlap. Each provider's output is saved as a separate file, the run counts as completed if at least one provider succeeds, and every failure is recorded. The run page shows the outputs side by side, in tabs, or as a JSON diff that counts added, removed and changed fields.
One interface for every model provider: Each adapter declares what the provider supports (OCR, annotations, vision, file types) and implements OCR and schema-constrained extraction; a factory hands out adapters and refuses unfinished ones (Anthropic is stubbed and shown as “coming soon”). The user's JSON Schema is rewritten per provider: closed objects for the strict modes of Mistral and OpenAI, required lists filled in, and keywords such as $schema and $defs dropped for Gemini and OpenAI.
Assistant that edits the canvas: The Reft Assistant sends the request, the conversation and the current canvas (nodes, edges, selected node) to the API. The system prompt carries the node catalogue, the allowed-link table, the implemented providers and models and each node type's defaults, and the model (any LiteLLM model, Gemini Flash by default) must answer in JSON: a message plus a list of actions. A parser keeps only known actions with valid payloads (add, remove or update a node, add or remove an edge, select a node, clear the canvas), 20 per turn by default. The client snapshots the canvas first (up to 50 snapshots, with keyboard undo and redo), maps the assistant's node IDs to real ones and applies every change through the same store methods as manual edits.
Results viewers: Partitioned documents open in a pdf.js viewer that draws every Unstructured element's box on the page; clicking an element in the list highlights the box. Extraction results sit beside the PDF as formatted fields or raw JSON, and output shaped like a bank statement gets account details, credit and debit totals and a transactions table filterable by source page. Results download as JSON, per provider for parallel runs.
REFT.UI design system: A /design-system page in the app documents the visual language: a monochrome neutral scale with a single accent, “Reft Teal” (#0d9488), four status colours, sharp-edged components (rounded-none) with high-contrast borders, uppercase tracked labels, status badges, a file-progress pattern (upload, OCR, extract, index) and Lucide icons at 20 px, always paired with text or set in a square. The shadcn button variants were rewritten to match.
Execution Flow
Draw the pipeline, or ask for one: Nodes are dragged onto the canvas, or the assistant is asked (“Create a PDF extraction pipeline with Mistral”) and returns actions that pass the same connection checks as manual edits; every assistant turn can be undone.
Configure and save: Each node is set up in the side panel; the extraction node takes a provider, a model and an output schema from the schema builder. Saving validates the graph in the browser and again in the API, which stores the canvas as JSONB.
Queue the run: The document is uploaded, a pending run is created and execute_pipeline is queued for a Celery worker; the API returns the run ID straight away.
Execute in dependency order: The worker sorts the graph and runs every node on the outputs of upstream nodes (partitioning, page splitting, schema extraction), launching extraction nodes that share a source together.
Store, poll, review: Outputs are saved as JSON (one file per provider for parallel runs) and the run is marked completed or failed with the error message. The editor, polling every two seconds, shows the finished run with a button into the results viewer; parallel runs also get a provider comparison on the run page.
Key Learnings
Have the model return actions, not prose. The assistant answers with a message and a list of typed actions; unknown types and malformed payloads are dropped, the prompt lists only implemented providers, and the client applies the remaining actions through the same checked store methods as manual edits, after an undo snapshot. A bad answer costs one undo, not a broken canvas.
One JSON Schema, three dialects. The same schema had to be rewritten per provider (closed objects and filled-in required lists for strict modes, unsupported $ keywords removed), so schema conversion lives in each adapter rather than in the UI.
asyncio.gather does not make blocking calls concurrent. The Mistral and Gemini SDKs are synchronous, so parallel extraction only overlapped requests once each call moved into a thread with asyncio.to_thread.
Fail fast on a dead dependency. The partitioner pings the self-hosted Unstructured API before each document (two 2-second tries by default), so a stopped VM fails the run in seconds with an “unreachable” error instead of risking a five-minute request timeout; responses worth retrying, such as 429 and 5xx, go back to Celery for another attempt.
Comparison is not evaluation. Side-by-side output and JSON diffs show where providers disagree, not which provider is right, and v1 had no labelled documents or scores. That gap set the direction for REFT v2, which scores the share of fields backed by a cited page and quote, and for docextract, which is scored on a public benchmark.